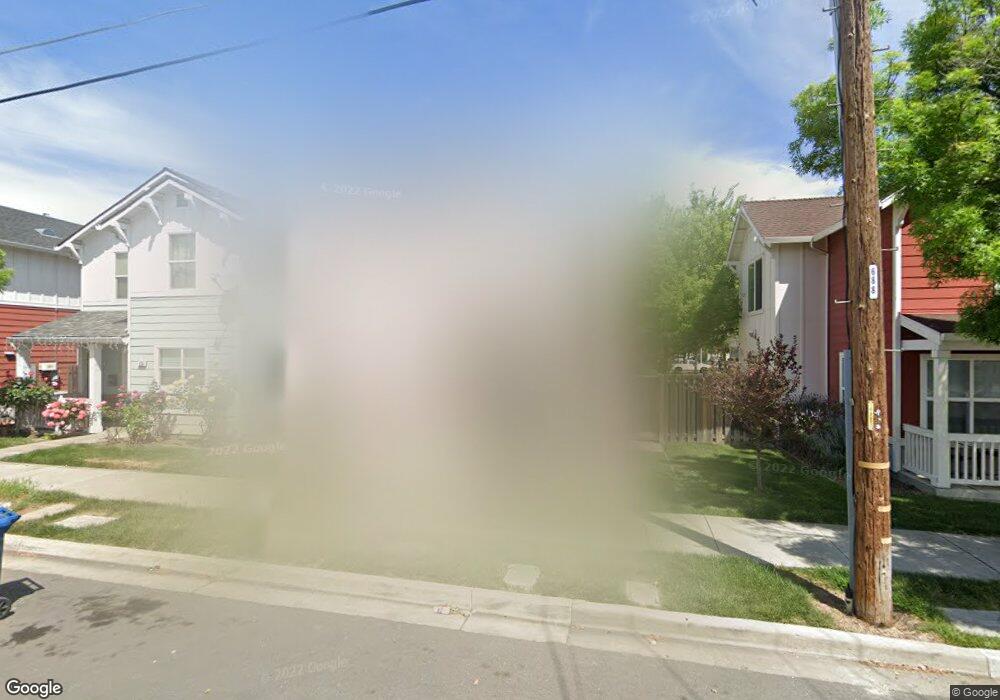
932 W 5th St Unit W Antioch, CA 94509
North Antioch NeighborhoodEstimated Value: $471,277 - $578,000
4
Beds
2
Baths
1,361
Sq Ft
$381/Sq Ft
Est. Value
About This Home
This home is located at 932 W 5th St Unit W, Antioch, CA 94509 and is currently estimated at $518,319, approximately $380 per square foot. 932 W 5th St Unit W is a home located in Contra Costa County with nearby schools including Fremont Elementary School, Antioch Middle School, and Antioch High School.
Ownership History
Date
Name
Owned For
Owner Type
Purchase Details
Closed on
Jan 22, 2008
Sold by
Habitat For Humanity East Bay Inc
Bought by
Keys Vickisha Ronquie
Current Estimated Value
Home Financials for this Owner
Home Financials are based on the most recent Mortgage that was taken out on this home.
Original Mortgage
$199,763
Outstanding Balance
$126,160
Interest Rate
6.17%
Mortgage Type
Unknown
Estimated Equity
$392,159
Purchase Details
Closed on
Jan 27, 2006
Sold by
Antioch Development Agency
Bought by
Mt Diablo Habitat For Humanity Inc
Home Financials for this Owner
Home Financials are based on the most recent Mortgage that was taken out on this home.
Original Mortgage
$380,000
Interest Rate
6.28%
Mortgage Type
Seller Take Back
Create a Home Valuation Report for This Property
The Home Valuation Report is an in-depth analysis detailing your home's value as well as a comparison with similar homes in the area
Home Values in the Area
Average Home Value in this Area
Purchase History
| Date | Buyer | Sale Price | Title Company |
|---|---|---|---|
| Keys Vickisha Ronquie | $352,000 | First American Title Company | |
| Mt Diablo Habitat For Humanity Inc | $260,000 | Financial Title |
Source: Public Records
Mortgage History
| Date | Status | Borrower | Loan Amount |
|---|---|---|---|
| Open | Keys Vickisha Ronquie | $199,763 | |
| Previous Owner | Mt Diablo Habitat For Humanity Inc | $380,000 |
Source: Public Records
Tax History Compared to Growth
Tax History
| Year | Tax Paid | Tax Assessment Tax Assessment Total Assessment is a certain percentage of the fair market value that is determined by local assessors to be the total taxable value of land and additions on the property. | Land | Improvement |
|---|---|---|---|---|
| 2025 | $3,626 | $289,612 | $26,260 | $263,352 |
| 2024 | $3,528 | $283,935 | $25,746 | $258,189 |
| 2023 | $3,528 | $278,369 | $25,242 | $253,127 |
| 2022 | $3,474 | $272,912 | $24,748 | $248,164 |
| 2021 | $3,336 | $267,562 | $24,263 | $243,299 |
| 2019 | $3,287 | $259,629 | $23,545 | $236,084 |
| 2018 | $3,170 | $254,539 | $23,084 | $231,455 |
| 2017 | $3,087 | $249,549 | $22,632 | $226,917 |
| 2016 | $3,012 | $244,657 | $22,189 | $222,468 |
| 2015 | $2,981 | $240,983 | $21,856 | $219,127 |
| 2014 | $2,891 | $236,263 | $21,428 | $214,835 |
Source: Public Records
Map
Nearby Homes