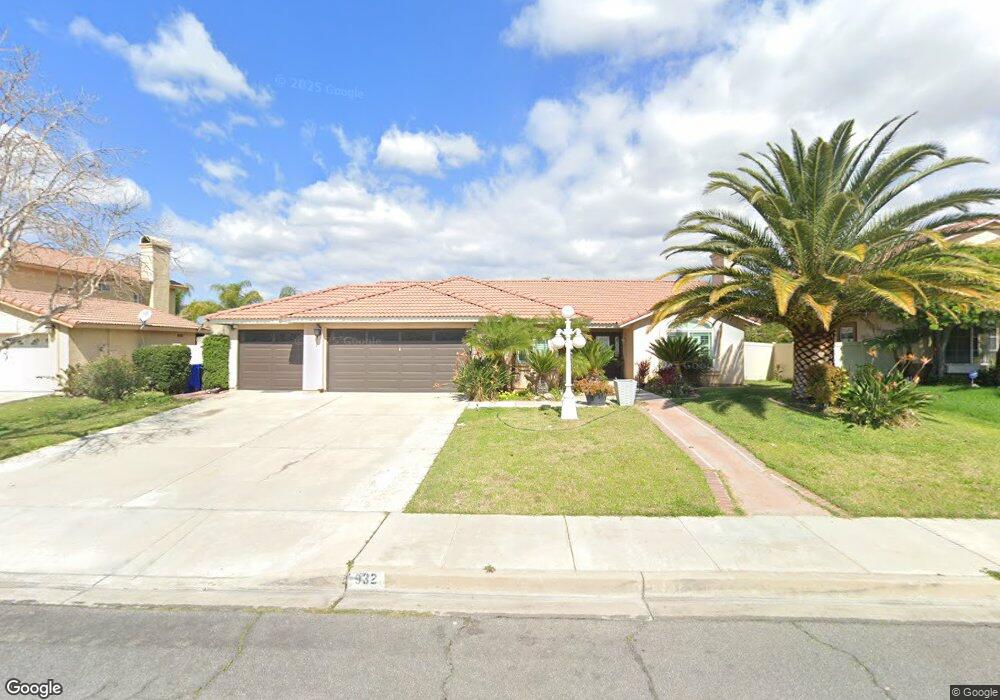
932 W Norwood St Rialto, CA 92377
Estimated Value: $597,000 - $678,000
4
Beds
2
Baths
1,413
Sq Ft
$443/Sq Ft
Est. Value
About This Home
This home is located at 932 W Norwood St, Rialto, CA 92377 and is currently estimated at $625,669, approximately $442 per square foot. 932 W Norwood St is a home located in San Bernardino County with nearby schools including Trapp Elementary School, Kolb Middle School, and Wilmer Amina Carter High School.
Ownership History
Date
Name
Owned For
Owner Type
Purchase Details
Closed on
Sep 5, 2007
Sold by
Villarreal Aracely
Bought by
Sepulveda Rafael and Sepulveda Rosa
Current Estimated Value
Purchase Details
Closed on
Jul 9, 2003
Sold by
Sepulveda Aracely
Bought by
Sepulveda Aracely and Sepulveda Rafael
Purchase Details
Closed on
Jan 24, 2002
Sold by
Burgess Georgette D
Bought by
Sepulveda Aracely
Home Financials for this Owner
Home Financials are based on the most recent Mortgage that was taken out on this home.
Original Mortgage
$32,600
Interest Rate
6.78%
Mortgage Type
Stand Alone Second
Purchase Details
Closed on
Aug 9, 1994
Sold by
Wright Neil A
Bought by
Burgess Georgette D and Burgess Lynne M
Home Financials for this Owner
Home Financials are based on the most recent Mortgage that was taken out on this home.
Original Mortgage
$119,116
Interest Rate
8.6%
Mortgage Type
FHA
Create a Home Valuation Report for This Property
The Home Valuation Report is an in-depth analysis detailing your home's value as well as a comparison with similar homes in the area
Home Values in the Area
Average Home Value in this Area
Purchase History
| Date | Buyer | Sale Price | Title Company |
|---|---|---|---|
| Sepulveda Rafael | -- | None Available | |
| Sepulveda Aracely | -- | -- | |
| Sepulveda Aracely | $163,000 | New Century Title Company | |
| Burgess Georgette D | -- | New Century Title Company | |
| Burgess Georgette D | $120,000 | Chicago Title Company |
Source: Public Records
Mortgage History
| Date | Status | Borrower | Loan Amount |
|---|---|---|---|
| Previous Owner | Burgess Georgette D | $32,600 | |
| Previous Owner | Sepulveda Aracely | $130,300 | |
| Previous Owner | Burgess Georgette D | $119,116 |
Source: Public Records
Tax History Compared to Growth
Tax History
| Year | Tax Paid | Tax Assessment Tax Assessment Total Assessment is a certain percentage of the fair market value that is determined by local assessors to be the total taxable value of land and additions on the property. | Land | Improvement |
|---|---|---|---|---|
| 2025 | $3,274 | $240,659 | $60,166 | $180,493 |
| 2024 | $3,274 | $235,940 | $58,986 | $176,954 |
| 2023 | $3,460 | $231,313 | $57,829 | $173,484 |
| 2022 | $3,207 | $226,777 | $56,695 | $170,082 |
| 2021 | $3,187 | $222,330 | $55,583 | $166,747 |
| 2020 | $3,194 | $220,050 | $55,013 | $165,037 |
| 2019 | $3,129 | $215,735 | $53,934 | $161,801 |
| 2018 | $3,026 | $211,504 | $52,876 | $158,628 |
| 2017 | $3,005 | $207,357 | $51,839 | $155,518 |
| 2016 | $2,635 | $203,292 | $50,823 | $152,469 |
| 2015 | $2,645 | $200,239 | $50,060 | $150,179 |
| 2014 | $2,489 | $196,316 | $49,079 | $147,237 |
Source: Public Records
Map
Nearby Homes
- 1074 W Casmalia St
- 1122 W Galway St
- 19244 Casmalia St
- 2425 N Fillmore Ave
- 2473 N Beechwood Ave
- 5874 Olive Ave
- 5737 Riverside Ave
- 19538 Cheshire St
- 2598 Ayala Dr Unit 34
- 5862 Geremander Ave
- 1388 Nicholas Ct
- 5651 Magnolia Ave
- 6795 Fillmore Ave
- 6210 Riverside Ave
- 1520 W Norwood St
- 1861 N Lilac Ave
- 19487 Chaparral St
- 1148 Thunderchief Ln
- 18464 Banyon Ave
- 1347 Yeager Ave
- 920 W Norwood St
- 944 W Norwood St
- 936 W La Gloria Dr
- 2219 N Beechwood Ave
- 958 W Norwood St
- 908 W Norwood St
- 2260 N Spruce Ave
- 952 W La Gloria Dr
- 919 W Norwood St
- 968 W La Gloria Dr
- 2207 N Beechwood Ave
- 970 W Norwood St
- 907 W Norwood St
- 2220 N Beechwood Ave
- 980 W La Gloria Dr
- 2208 N Beechwood Ave
- 2193 N Beechwood Ave
- 2292 N Beechwood Ave
- 2291 N Beechwood Ave
- 982 W Norwood St