Estimated Value: $208,729 - $267,000
3
Beds
1
Bath
960
Sq Ft
$242/Sq Ft
Est. Value
About This Home
This home is located at 9320 E 50 S, Knox, IN 46534 and is currently estimated at $232,576, approximately $242 per square foot. 9320 E 50 S is a home located in Starke County with nearby schools including Knox Community Elementary School, Knox Community Middle School, and Knox Community High School.
Ownership History
Date
Name
Owned For
Owner Type
Purchase Details
Closed on
Nov 5, 2025
Sold by
Rans Kathrine A and Rodgers Charles Lee
Bought by
Rodgers Maggie and Coiner Colby James
Current Estimated Value
Home Financials for this Owner
Home Financials are based on the most recent Mortgage that was taken out on this home.
Original Mortgage
$150,000
Outstanding Balance
$150,000
Interest Rate
6.3%
Mortgage Type
New Conventional
Estimated Equity
$82,576
Purchase Details
Closed on
Jul 1, 2015
Sold by
Rodgers Leslie C
Bought by
Rans Kathrine A and Rodges Charlie L
Purchase Details
Closed on
Oct 7, 2010
Sold by
Gates Lauralee R
Bought by
Rodgers Leslie C
Create a Home Valuation Report for This Property
The Home Valuation Report is an in-depth analysis detailing your home's value as well as a comparison with similar homes in the area
Purchase History
| Date | Buyer | Sale Price | Title Company |
|---|---|---|---|
| Rodgers Maggie | -- | First American Title | |
| Rans Kathrine A | -- | None Available | |
| Rodgers Leslie C | -- | None Available |
Source: Public Records
Mortgage History
| Date | Status | Borrower | Loan Amount |
|---|---|---|---|
| Open | Rodgers Maggie | $150,000 |
Source: Public Records
Tax History
| Year | Tax Paid | Tax Assessment Tax Assessment Total Assessment is a certain percentage of the fair market value that is determined by local assessors to be the total taxable value of land and additions on the property. | Land | Improvement |
|---|---|---|---|---|
| 2025 | $617 | $115,600 | $28,500 | $87,100 |
| 2024 | $617 | $109,100 | $28,400 | $80,700 |
| 2023 | $496 | $97,900 | $25,000 | $72,900 |
| 2022 | $496 | $88,700 | $22,700 | $66,000 |
| 2021 | $441 | $78,400 | $21,900 | $56,500 |
| 2020 | $530 | $71,600 | $21,900 | $49,700 |
| 2019 | $464 | $68,800 | $23,000 | $45,800 |
| 2018 | $509 | $69,400 | $24,900 | $44,500 |
| 2017 | $603 | $72,100 | $30,200 | $41,900 |
| 2016 | $622 | $72,600 | $31,100 | $41,500 |
| 2014 | $566 | $72,700 | $31,800 | $40,900 |
| 2013 | $512 | $70,000 | $29,400 | $40,600 |
Source: Public Records
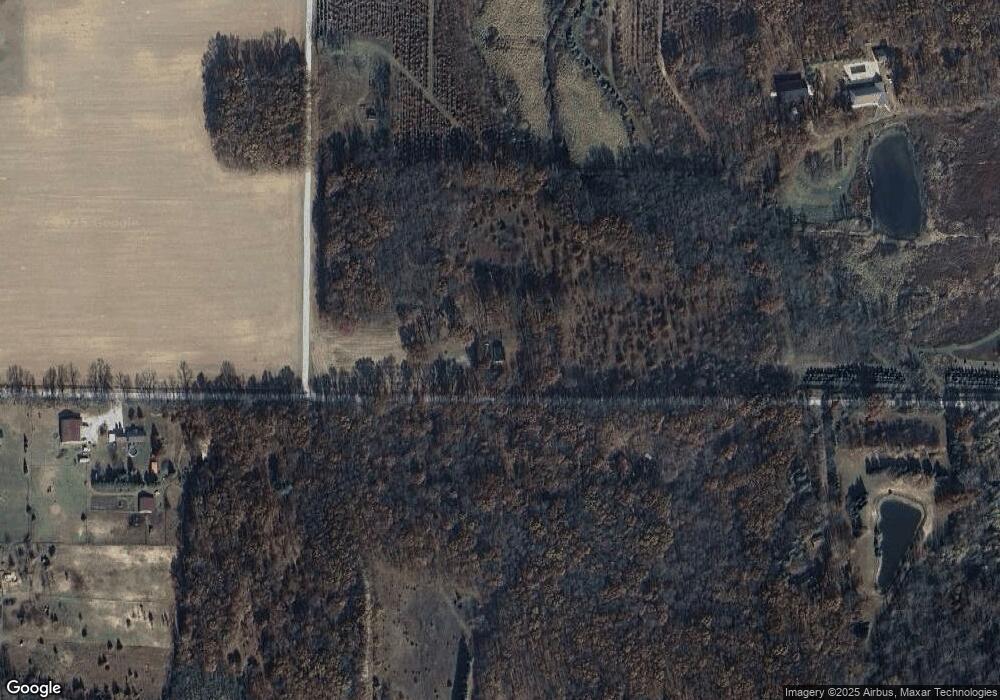
Map
Nearby Homes
Your Personal Tour Guide
Ask me questions while you tour the home.