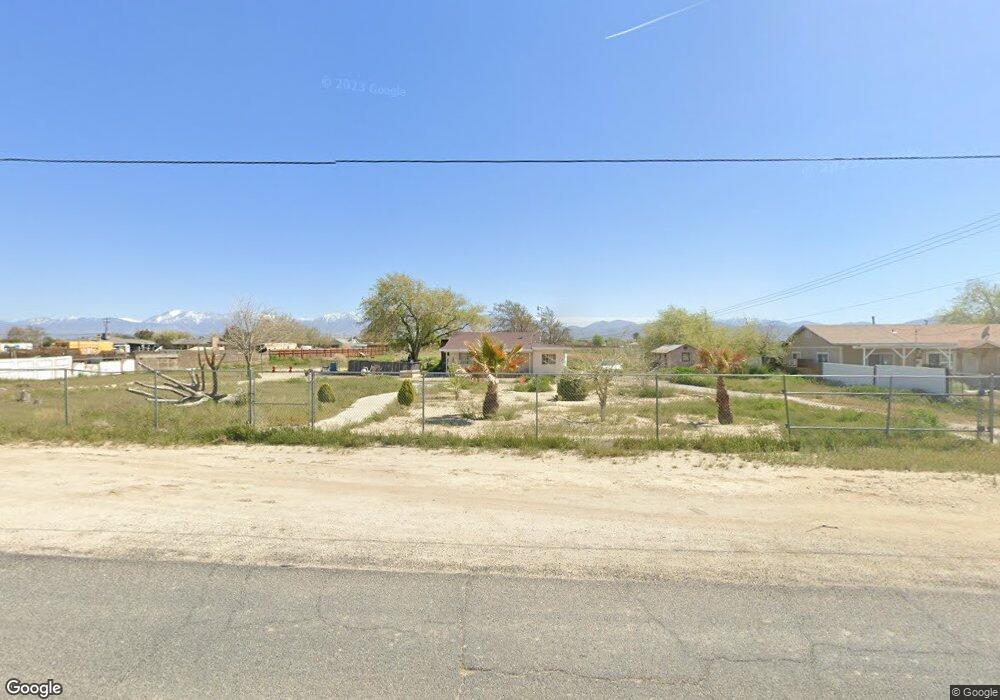
9320 E Avenue R Littlerock, CA 93543
Estimated Value: $221,000 - $339,000
1
Bed
1
Bath
744
Sq Ft
$355/Sq Ft
Est. Value
About This Home
This home is located at 9320 E Avenue R, Littlerock, CA 93543 and is currently estimated at $263,765, approximately $354 per square foot. 9320 E Avenue R is a home located in Los Angeles County with nearby schools including Daisy Gibson Elementary School, Keppel Academy, and Littlerock High School.
Ownership History
Date
Name
Owned For
Owner Type
Purchase Details
Closed on
Mar 30, 2004
Sold by
Quintana Blanca Fabiola and Alonso Francisco
Bought by
Quintana Blanca Fabiola
Current Estimated Value
Home Financials for this Owner
Home Financials are based on the most recent Mortgage that was taken out on this home.
Original Mortgage
$109,620
Outstanding Balance
$51,262
Interest Rate
5.57%
Mortgage Type
FHA
Estimated Equity
$212,503
Purchase Details
Closed on
May 16, 2002
Sold by
Pakinagad Arastu
Bought by
Quintana Blanca Fabiola
Home Financials for this Owner
Home Financials are based on the most recent Mortgage that was taken out on this home.
Original Mortgage
$79,500
Interest Rate
6.6%
Purchase Details
Closed on
Oct 20, 1994
Sold by
Camras Barbara J
Bought by
Pakinagad Arastu
Home Financials for this Owner
Home Financials are based on the most recent Mortgage that was taken out on this home.
Original Mortgage
$30,910
Interest Rate
8.9%
Mortgage Type
Seller Take Back
Create a Home Valuation Report for This Property
The Home Valuation Report is an in-depth analysis detailing your home's value as well as a comparison with similar homes in the area
Home Values in the Area
Average Home Value in this Area
Purchase History
We collect this data history from publicly available records. To have your information removed, we recommend requesting removal directly through your county’s website.
| Date | Buyer | Sale Price | Title Company |
|---|---|---|---|
| Quintana Blanca Fabiola | -- | -- | |
| Quintana Blanca Fabiola | $82,000 | Chicago Title Co | |
| Pakinagad Arastu | $34,500 | Stewart Title | |
| Pakinagad Arastu | -- | Stewart Title |
Source: Public Records
Mortgage History
We collect this data history from publicly available records. To have your information removed, we recommend requesting removal directly through your county’s website.
| Date | Status | Borrower | Loan Amount |
|---|---|---|---|
| Open | Quintana Blanca Fabiola | $109,620 | |
| Previous Owner | Quintana Blanca Fabiola | $79,500 | |
| Previous Owner | Pakinagad Arastu | $30,910 |
Source: Public Records
Tax History
| Year | Tax Paid | Tax Assessment Tax Assessment Total Assessment is a certain percentage of the fair market value that is determined by local assessors to be the total taxable value of land and additions on the property. | Land | Improvement |
|---|---|---|---|---|
| 2025 | $1,646 | $118,736 | $52,997 | $65,739 |
| 2024 | $1,559 | $116,408 | $51,958 | $64,450 |
| 2023 | $1,528 | $114,127 | $50,940 | $63,187 |
| 2022 | $1,502 | $111,891 | $49,942 | $61,949 |
| 2021 | $1,474 | $109,698 | $48,963 | $60,735 |
| 2019 | $1,430 | $106,446 | $47,511 | $58,935 |
| 2018 | $1,438 | $104,360 | $46,580 | $57,780 |
| 2016 | $1,354 | $100,310 | $44,772 | $55,538 |
| 2015 | $1,336 | $98,804 | $44,100 | $54,704 |
| 2014 | $1,308 | $91,000 | $40,600 | $50,400 |
Source: Public Records
Map
Nearby Homes
- 0 Cor Avenue R 96th Ste Unit 26002423
- 9608 E Avenue Q-12
- 0000 E
- 0 E Palmdale Blvd Vic 155 St E
- 90 E Palmdale Blvd
- 8700 E Palmdale Blvd
- 37506 95th St E
- 9340 E Avenue r10
- 1000 100th St E
- 108th Ste E Palmdale Blvd
- 0 E St Unit 26003182
- 0 Cor Ave R8 100th Ste Unit 25005146
- 90th St E Palmdale Blvd
- 000 E Cor Palmdale Blvd & 100th St E Blvd
- 4 E Avenue q4
- 10120 E Avenue q12
- 100 E Palmdale Blvd
- 9030 E Palmdale Blvd
- VIC E Palmdale Blvd
- 9837 E Avenue r10
- 9310 E Avenue R
- 0 Ave R Pav Vic 94th Ste Unit Ste Littlerock
- 9304 E Avenue R
- 9329 E Avenue R
- 9313 E Avenue R
- 9341 E Avenue R
- 37943 95th St E Unit 9
- 37943 95th St E
- 9360 E Avenue R
- 0 Vac Ave R Pav Vic 94th Unit Ste Littlerock
- 37925 95th St E
- 9361 E Avenue R
- 9251 E Avenue R
- 37909 95th St E
- 9235 E Avenue R
- 9507 E Avenue R
- 9210 E Avenue R
- 9525 E Avenue R
- 9316 E Avenue q14
- 9219 E Avenue R
Your Personal Tour Guide
Ask me questions while you tour the home.