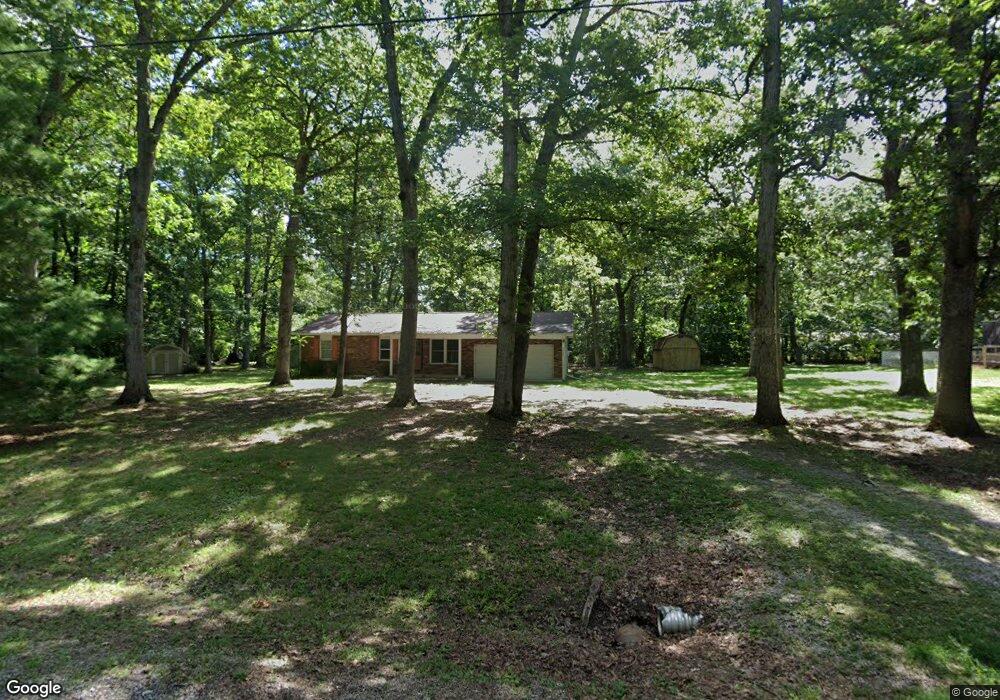
9320 E South Circle Dr Effingham, IL 62401
Estimated Value: $144,000 - $241,000
3
Beds
2
Baths
1,168
Sq Ft
$170/Sq Ft
Est. Value
About This Home
This home is located at 9320 E South Circle Dr, Effingham, IL 62401 and is currently estimated at $199,066, approximately $170 per square foot. 9320 E South Circle Dr is a home located in Effingham County with nearby schools including Beecher City Grade School and Beecher City Junior/Senior High School.
Ownership History
Date
Name
Owned For
Owner Type
Purchase Details
Closed on
Aug 22, 2019
Sold by
Newsome Angela
Bought by
Buhrke Gary G
Current Estimated Value
Home Financials for this Owner
Home Financials are based on the most recent Mortgage that was taken out on this home.
Original Mortgage
$23,000
Interest Rate
4.75%
Mortgage Type
Future Advance Clause Open End Mortgage
Purchase Details
Closed on
Jul 10, 2018
Sold by
Thoele Ran Dall J
Bought by
Newsome Angela
Home Financials for this Owner
Home Financials are based on the most recent Mortgage that was taken out on this home.
Original Mortgage
$90,000
Interest Rate
4.6%
Mortgage Type
Commercial
Purchase Details
Closed on
Oct 1, 2014
Sold by
Probst James
Bought by
Thoele Randall J
Home Financials for this Owner
Home Financials are based on the most recent Mortgage that was taken out on this home.
Original Mortgage
$72,800
Interest Rate
4.08%
Mortgage Type
New Conventional
Create a Home Valuation Report for This Property
The Home Valuation Report is an in-depth analysis detailing your home's value as well as a comparison with similar homes in the area
Purchase History
| Date | Buyer | Sale Price | Title Company |
|---|---|---|---|
| Buhrke Gary G | $123,000 | The Title Center | |
| Newsome Angela | $122,000 | Attorney | |
| Thoele Randall J | -- | None Available |
Source: Public Records
Mortgage History
| Date | Status | Borrower | Loan Amount |
|---|---|---|---|
| Closed | Buhrke Gary G | $23,000 | |
| Previous Owner | Newsome Angela | $90,000 | |
| Previous Owner | Thoele Randall J | $72,800 |
Source: Public Records
Tax History
| Year | Tax Paid | Tax Assessment Tax Assessment Total Assessment is a certain percentage of the fair market value that is determined by local assessors to be the total taxable value of land and additions on the property. | Land | Improvement |
|---|---|---|---|---|
| 2024 | $1,495 | $49,960 | $5,540 | $44,420 |
| 2023 | $1,545 | $45,210 | $5,010 | $40,200 |
| 2022 | $1,590 | $41,860 | $4,640 | $37,220 |
| 2021 | $1,625 | $39,870 | $4,420 | $35,450 |
| 2020 | $1,947 | $38,340 | $4,250 | $34,090 |
| 2019 | $2,268 | $37,230 | $4,130 | $33,100 |
| 2018 | $2,171 | $35,450 | $3,930 | $31,520 |
| 2017 | $2,123 | $34,750 | $3,850 | $30,900 |
| 2016 | $2,053 | $33,250 | $3,680 | $29,570 |
| 2015 | -- | $32,920 | $3,640 | $29,280 |
| 2014 | -- | $32,590 | $3,600 | $28,990 |
| 2013 | -- | $32,590 | $3,600 | $28,990 |
| 2012 | -- | $32,590 | $3,600 | $28,990 |
Source: Public Records
Map
Nearby Homes
- 15052 N 16th Ave
- 14748 N Court 7
- 9284 E Court 11
- 14689 N Court 6
- 9219 E Best Ct
- 15482 N Wildwood Dr
- 14744 N Court 1
- 14704 N Court 1
- 15872 N Bluebird Dr
- 15981 N Hillcrest Dr
- 15243 N Holden Ave
- 24 N Country Club Rd
- 21 N Country Club Rd
- 13120 Augusta National Dr
- 9 N Country Club Rd
- 8 N Country Club Rd
- 11107 E Cambridge Ln
- 11020 E Lake Edward Ln
- 11154 E Ravenwood Ct
- 12990 Country Club Rd
- 9320 E Circle Dr
- 9320 E South Circle Dr
- 9342 E South Circle Dr
- 9106 E South Circle Dr
- 9106 E South Circle Dr
- 9323 E South Circle Dr
- 9358 E South Circle Dr
- 9323 E Circle Dr
- 9323 E South Circle Dr
- 9032 E South Circle Dr
- 14772 N 11th Ave
- 9372 E South Circle Dr
- 9008 E South Circle Dr
- 9079 E South Circle Dr
- 14702 N 7th Ave
- 14702 7th Ave
- 8 8th Ave
- 9283 E South Circle Dr
- 9267 E South Circle Dr
- 9091 E South Circle Dr
Your Personal Tour Guide
Ask me questions while you tour the home.