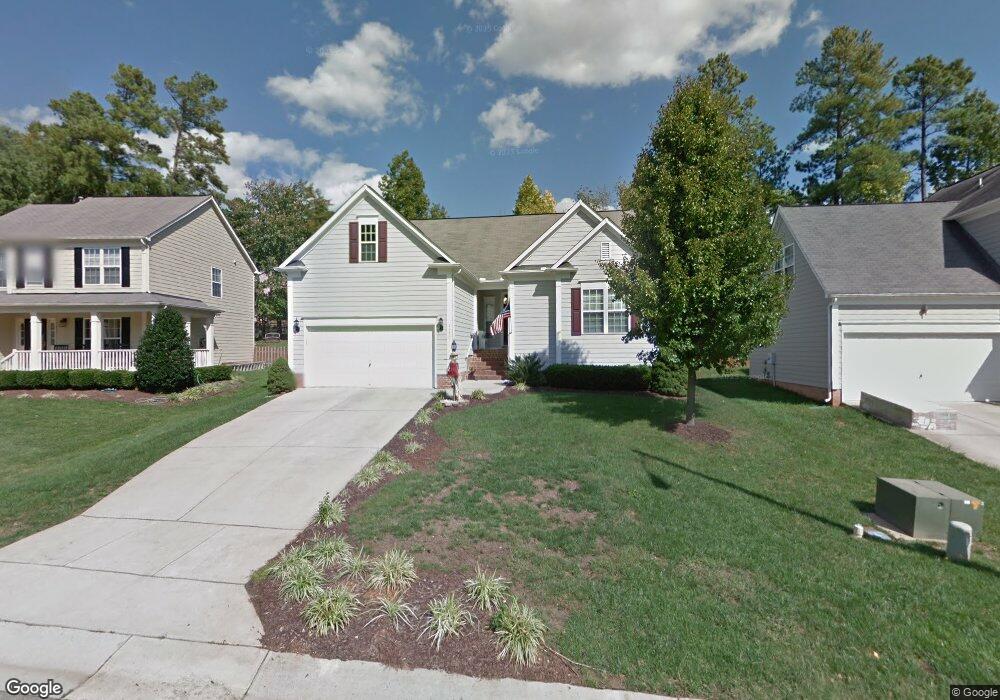
9320 Langwood Dr Raleigh, NC 27617
Umstead NeighborhoodEstimated Value: $441,000 - $490,000
3
Beds
2
Baths
1,810
Sq Ft
$256/Sq Ft
Est. Value
About This Home
This home is located at 9320 Langwood Dr, Raleigh, NC 27617 and is currently estimated at $463,266, approximately $255 per square foot. 9320 Langwood Dr is a home located in Wake County with nearby schools including Leesville Road Elementary School, Leesville Road Middle School, and Leesville Road High School.
Ownership History
Date
Name
Owned For
Owner Type
Purchase Details
Closed on
Jan 10, 2008
Sold by
Skelton Karen A
Bought by
Skelton Karen A
Current Estimated Value
Purchase Details
Closed on
Aug 30, 2001
Sold by
Loftus Lloyd Kevin and Loftus Christina
Bought by
Skelton Jesse F and Skelton Karen A
Home Financials for this Owner
Home Financials are based on the most recent Mortgage that was taken out on this home.
Original Mortgage
$60,000
Interest Rate
7.08%
Purchase Details
Closed on
Sep 23, 1998
Sold by
Beazer Homes Corp
Bought by
Loftus Lloyd Kevin and Loftus Christina
Home Financials for this Owner
Home Financials are based on the most recent Mortgage that was taken out on this home.
Original Mortgage
$159,050
Interest Rate
6.62%
Purchase Details
Closed on
Apr 17, 1998
Sold by
Baylor Boys Inc
Bought by
Beazer Homes Corp
Create a Home Valuation Report for This Property
The Home Valuation Report is an in-depth analysis detailing your home's value as well as a comparison with similar homes in the area
Home Values in the Area
Average Home Value in this Area
Purchase History
| Date | Buyer | Sale Price | Title Company |
|---|---|---|---|
| Skelton Karen A | -- | None Available | |
| Skelton Jesse F | $185,000 | -- | |
| Loftus Lloyd Kevin | $168,000 | -- | |
| Beazer Homes Corp | $54,500 | -- |
Source: Public Records
Mortgage History
| Date | Status | Borrower | Loan Amount |
|---|---|---|---|
| Previous Owner | Skelton Jesse F | $60,000 | |
| Previous Owner | Loftus Lloyd Kevin | $159,050 |
Source: Public Records
Tax History Compared to Growth
Tax History
| Year | Tax Paid | Tax Assessment Tax Assessment Total Assessment is a certain percentage of the fair market value that is determined by local assessors to be the total taxable value of land and additions on the property. | Land | Improvement |
|---|---|---|---|---|
| 2025 | $4,396 | $501,784 | $170,000 | $331,784 |
| 2024 | $4,378 | $501,784 | $170,000 | $331,784 |
| 2023 | $3,299 | $300,866 | $80,000 | $220,866 |
| 2022 | $3,066 | $300,866 | $80,000 | $220,866 |
| 2021 | $2,947 | $300,866 | $80,000 | $220,866 |
| 2020 | $2,894 | $300,866 | $80,000 | $220,866 |
| 2019 | $2,766 | $236,918 | $70,000 | $166,918 |
| 2018 | $2,609 | $236,918 | $70,000 | $166,918 |
| 2017 | $2,485 | $236,918 | $70,000 | $166,918 |
| 2016 | $0 | $236,918 | $70,000 | $166,918 |
| 2015 | -- | $234,613 | $66,000 | $168,613 |
| 2014 | -- | $234,613 | $66,000 | $168,613 |
Source: Public Records
Map
Nearby Homes
- 9337 Langwood Dr
- 9305 Langwood Dr
- 9209 Shallcross Way
- 9800 Treymore Dr
- 9023 Colony Village Ln
- 13204 Ashford Park Dr
- 13217 Ashford Park Dr
- 6123 Blakeman Ln
- 7942 Berry Crest Ave
- 9305 Dominion Blvd
- 10900 Bayflower Way
- 10901 Bayflower Way
- 10907 Bayflower Way
- 7846 Cape Charles Dr
- 10906 Bayflower Way
- 10916 Bayflower Way
- 9309 Field Maple Ct
- 10917 Bayflower Way
- 9305 Field Maple Ct
- 12909 Baybriar Dr
- 9316 Langwood Dr
- 9324 Langwood Dr
- 5329 Bartram Place
- 9312 Langwood Dr
- 5325 Bartram Place
- 5333 Bartram Place
- 9328 Langwood Dr
- 5321 Bartram Place
- 9325 Langwood Dr
- 9321 Langwood Dr
- 5337 Bartram Place
- 9308 Langwood Dr
- 9317 Langwood Dr
- 5317 Bartram Place
- 9329 Langwood Dr
- 9332 Langwood Dr
- 9313 Langwood Dr
- 9304 Langwood Dr
- 5313 Bartram Place
- 9336 Langwood Dr