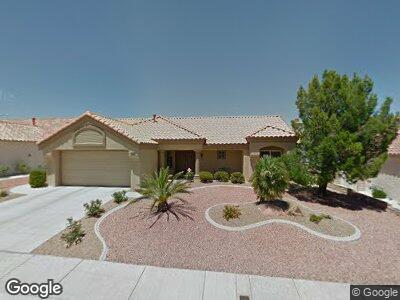
9320 Yucca Blossom Dr Las Vegas, NV 89134
Sun City Summerlin NeighborhoodEstimated Value: $402,000 - $448,000
2
Beds
2
Baths
1,384
Sq Ft
$310/Sq Ft
Est. Value
About This Home
This home is located at 9320 Yucca Blossom Dr, Las Vegas, NV 89134 and is currently estimated at $429,687, approximately $310 per square foot. 9320 Yucca Blossom Dr is a home located in Clark County with nearby schools including William Lummis Elementary School, Ernest Becker Middle School, and Palo Verde High School.
Ownership History
Date
Name
Owned For
Owner Type
Purchase Details
Closed on
Oct 23, 2014
Sold by
Sinai Judy
Bought by
Judy Sinai Living Trust
Current Estimated Value
Purchase Details
Closed on
May 16, 2007
Sold by
Sinai George H
Bought by
Sinai Judy G
Home Financials for this Owner
Home Financials are based on the most recent Mortgage that was taken out on this home.
Original Mortgage
$100,000
Interest Rate
6.14%
Mortgage Type
Unknown
Purchase Details
Closed on
Apr 25, 2007
Sold by
Golberg Michael and Golberg Joyce A
Bought by
Sinai Judy
Home Financials for this Owner
Home Financials are based on the most recent Mortgage that was taken out on this home.
Original Mortgage
$100,000
Interest Rate
6.14%
Mortgage Type
Unknown
Purchase Details
Closed on
Jun 12, 2006
Sold by
Hartstein Gary J
Bought by
Golberg Michael and Golberg Joyce A
Purchase Details
Closed on
May 21, 2002
Sold by
Hartstein Harry J and Hartstein Miriam
Bought by
Hartstein Gary J
Create a Home Valuation Report for This Property
The Home Valuation Report is an in-depth analysis detailing your home's value as well as a comparison with similar homes in the area
Home Values in the Area
Average Home Value in this Area
Purchase History
| Date | Buyer | Sale Price | Title Company |
|---|---|---|---|
| Judy Sinai Living Trust | -- | None Available | |
| Sinai Judy G | -- | First Amer Title Co Of Nv | |
| Sinai Judy | $250,000 | First Amer Title Co Of Nv | |
| Golberg Michael | $255,000 | Equity Title Of Nevada | |
| Hartstein Gary J | -- | -- |
Source: Public Records
Mortgage History
| Date | Status | Borrower | Loan Amount |
|---|---|---|---|
| Open | Sinai Judy G | $105,123 | |
| Closed | Sinai Judy G | $109,000 | |
| Closed | Sinai Judy | $100,000 |
Source: Public Records
Tax History Compared to Growth
Tax History
| Year | Tax Paid | Tax Assessment Tax Assessment Total Assessment is a certain percentage of the fair market value that is determined by local assessors to be the total taxable value of land and additions on the property. | Land | Improvement |
|---|---|---|---|---|
| 2025 | $2,076 | $94,001 | $43,400 | $50,601 |
| 2024 | $2,016 | $94,001 | $43,400 | $50,601 |
| 2023 | $2,016 | $83,664 | $35,000 | $48,664 |
| 2022 | $1,958 | $75,141 | $30,450 | $44,691 |
| 2021 | $1,901 | $71,564 | $28,700 | $42,864 |
| 2020 | $1,843 | $71,364 | $28,700 | $42,664 |
| 2019 | $1,789 | $66,343 | $24,150 | $42,193 |
| 2018 | $1,737 | $61,291 | $20,300 | $40,991 |
| 2017 | $1,968 | $59,161 | $18,200 | $40,961 |
| 2016 | $1,645 | $57,270 | $16,100 | $41,170 |
| 2015 | $1,641 | $54,091 | $13,300 | $40,791 |
| 2014 | $1,593 | $50,710 | $11,550 | $39,160 |
Source: Public Records
Map
Nearby Homes
- 9312 Yucca Blossom Dr
- 9400 Grand Mesa Dr
- 9409 January Dr Unit 1
- 2820 Bluff Point Dr
- 9201 Cactus Wood Dr
- 2824 Dry Plains Dr
- 9445 January Dr
- 9445 Grand Mesa Dr
- 2829 Golf Links Dr
- 9513 Yucca Blossom Dr
- 9512 Quail Ridge Dr
- 2917 Golf Links Dr
- 9369 Villa Ridge Dr
- 9533 Yucca Blossom Dr
- 9524 Quail Ridge Dr
- 2729 Echo Mesa Dr
- 3100 Angelica Ct
- 3105 Birch Hill Ct Unit 26
- 9425 Villa Ridge Dr
- 9105 Marble Dr
- 9320 Yucca Blossom Dr
- 9316 Yucca Blossom Dr
- 9324 Yucca Blossom Dr
- 9333 Quail Ridge Dr
- 9329 Quail Ridge Dr
- 9337 Quail Ridge Dr
- 9321 Yucca Blossom Dr
- 9325 Yucca Blossom Dr Unit 24
- 9317 Yucca Blossom Dr
- 9321 Quail Ridge Dr
- 9400 Yucca Blossom Dr
- 9308 Yucca Blossom Dr
- 9313 Yucca Blossom Dr
- 9401 Quail Ridge Dr
- 9317 Quail Ridge Dr
- 9320 Cascade Hills Dr
- 9332 Quail Ridge Dr Unit 24
- 9328 Quail Ridge Dr
- 2849 Desert Crystal Dr
- 9336 Quail Ridge Dr