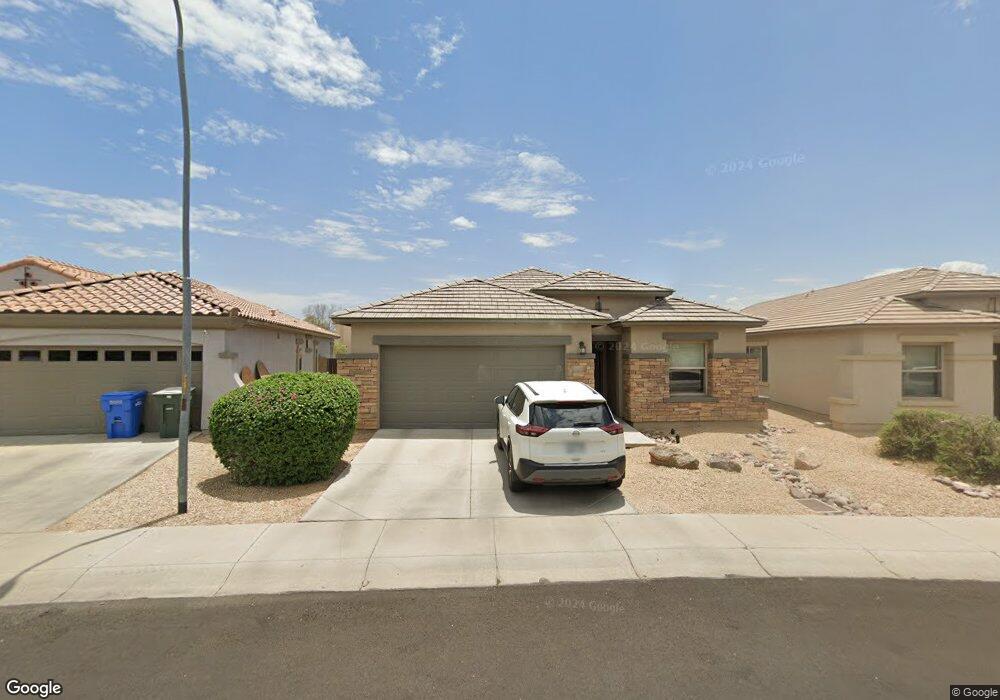
9321 W Milkweed Loop Phoenix, AZ 85037
Estimated Value: $349,010 - $415,000
4
Beds
2
Baths
1,769
Sq Ft
$219/Sq Ft
Est. Value
About This Home
This home is located at 9321 W Milkweed Loop, Phoenix, AZ 85037 and is currently estimated at $387,253, approximately $218 per square foot. 9321 W Milkweed Loop is a home located in Maricopa County with nearby schools including Sheely Farms Elementary School, Tolleson Union High School, and Pan-American Charter School.
Ownership History
Date
Name
Owned For
Owner Type
Purchase Details
Closed on
Sep 8, 2011
Sold by
Wohlwend Thomas and Wohlwend Thomas G
Bought by
Wohlwend Thomas G and Burns Kevin M
Current Estimated Value
Purchase Details
Closed on
Dec 31, 2009
Sold by
Hemco Inc
Bought by
Wohlwend Thomas
Purchase Details
Closed on
Oct 8, 2009
Sold by
Arias Jasen R
Bought by
Hemco Inc
Home Financials for this Owner
Home Financials are based on the most recent Mortgage that was taken out on this home.
Original Mortgage
$97,901
Interest Rate
5.02%
Mortgage Type
Purchase Money Mortgage
Purchase Details
Closed on
Feb 24, 2005
Sold by
Fowler Christiana S
Bought by
Arias Jasen R
Home Financials for this Owner
Home Financials are based on the most recent Mortgage that was taken out on this home.
Original Mortgage
$218,500
Interest Rate
8.16%
Mortgage Type
Purchase Money Mortgage
Create a Home Valuation Report for This Property
The Home Valuation Report is an in-depth analysis detailing your home's value as well as a comparison with similar homes in the area
Purchase History
| Date | Buyer | Sale Price | Title Company |
|---|---|---|---|
| Wohlwend Thomas G | $65,000 | None Available | |
| Wohlwend Thomas | $135,000 | Grand Canyon Title Agency In | |
| Hemco Inc | $97,901 | Accommodation | |
| Arias Jasen R | -- | Commerce Title Co |
Source: Public Records
Mortgage History
| Date | Status | Borrower | Loan Amount |
|---|---|---|---|
| Previous Owner | Hemco Inc | $97,901 | |
| Previous Owner | Arias Jasen R | $218,500 |
Source: Public Records
Tax History
| Year | Tax Paid | Tax Assessment Tax Assessment Total Assessment is a certain percentage of the fair market value that is determined by local assessors to be the total taxable value of land and additions on the property. | Land | Improvement |
|---|---|---|---|---|
| 2025 | $2,013 | $13,395 | -- | -- |
| 2024 | $1,802 | $12,758 | -- | -- |
| 2023 | $1,802 | $27,030 | $5,400 | $21,630 |
| 2022 | $1,740 | $21,300 | $4,260 | $17,040 |
| 2021 | $1,660 | $20,520 | $4,100 | $16,420 |
| 2020 | $1,618 | $18,470 | $3,690 | $14,780 |
| 2019 | $1,614 | $16,960 | $3,390 | $13,570 |
| 2018 | $1,476 | $15,700 | $3,140 | $12,560 |
| 2017 | $1,334 | $13,270 | $2,650 | $10,620 |
| 2016 | $1,268 | $12,780 | $2,550 | $10,230 |
| 2015 | $1,209 | $11,750 | $2,350 | $9,400 |
Source: Public Records
Map
Nearby Homes
- 9171 W Berkeley Rd
- 9422 W Palm Ln
- 9418 W Eaton Rd
- 9407 W Eaton Rd
- 2227 N 92nd Dale
- 2218 N 91st Ln
- 9002 W Coronado Rd
- 8922 W Monte Vista Rd
- 1802 N 89th Ave
- 9419 W Virginia Ave
- 9427 W Virginia Ave
- 2421 N 92nd Glen
- 8838 W Encanto Blvd
- 8837 W Virginia Ave
- 2705 N 90th Ave
- 8544 W Holly St
- 8807 W Christa Way
- 9553 W Verde Ln
- 9152 W Garfield St
- 10773 W Baden St
- 9317 W Milkweed Loop
- 9325 W Milkweed Loop
- 9313 W Milkweed Loop
- 9329 W Milkweed Loop
- 9242 W Berkeley Rd
- 9238 W Berkeley Rd
- 9250 W Berkeley Rd
- 9246 W Berkeley Rd
- 9254 W Berkeley Rd
- 9234 W Berkeley Rd
- 9309 W Milkweed Loop
- 9333 W Milkweed Loop
- 9258 W Berkeley Rd
- 9316 W Milkweed Loop
- 9230 W Berkeley Rd
- 9328 W Milkweed Loop
- 9305 W Milkweed Loop
- 9262 W Berkeley Rd
- 9312 W Milkweed Loop
- 9337 W Milkweed Loop
Your Personal Tour Guide
Ask me questions while you tour the home.