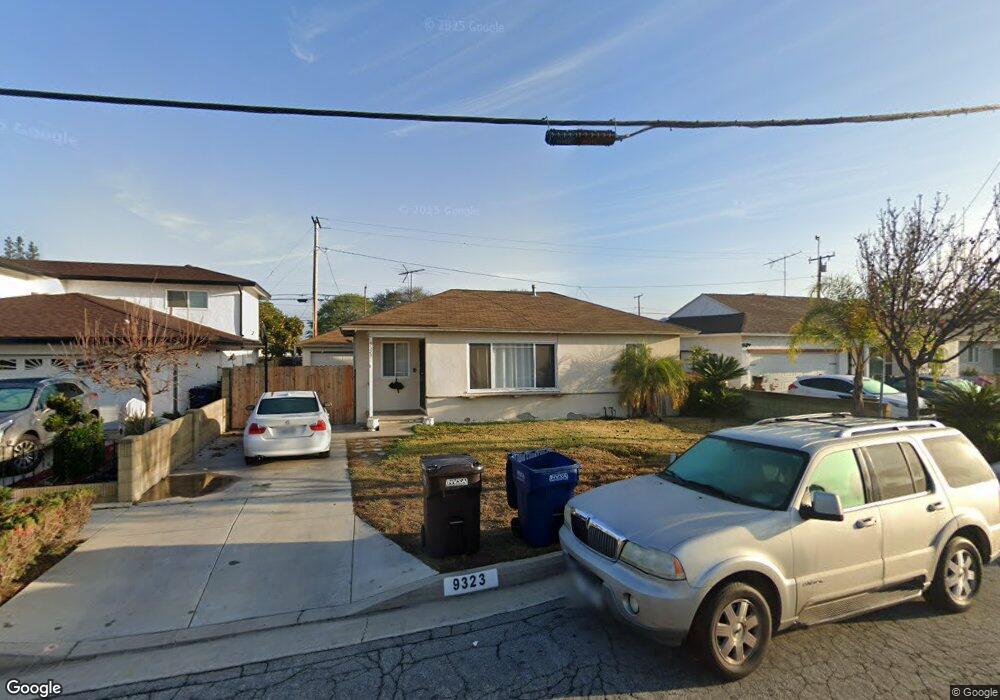
9323 Tilmont St Pico Rivera, CA 90660
Estimated Value: $697,000 - $708,000
3
Beds
2
Baths
1,121
Sq Ft
$627/Sq Ft
Est. Value
About This Home
This home is located at 9323 Tilmont St, Pico Rivera, CA 90660 and is currently estimated at $702,963, approximately $627 per square foot. 9323 Tilmont St is a home located in Los Angeles County with nearby schools including Durfee Elementary School, North Park Middle School, and Ruben Salazar Continuation School.
Ownership History
Date
Name
Owned For
Owner Type
Purchase Details
Closed on
Jul 16, 2001
Sold by
Medrano Tommy and Medrano Rebecca
Bought by
Franco Hilario
Current Estimated Value
Home Financials for this Owner
Home Financials are based on the most recent Mortgage that was taken out on this home.
Original Mortgage
$174,265
Outstanding Balance
$67,206
Interest Rate
7.15%
Mortgage Type
FHA
Estimated Equity
$635,757
Purchase Details
Closed on
Oct 27, 1993
Sold by
Duran Ruben G
Bought by
Duran Ramon E
Purchase Details
Closed on
Mar 8, 1993
Sold by
Duran Ramon E and Duran Blanca G
Bought by
Medrano Tommy A
Home Financials for this Owner
Home Financials are based on the most recent Mortgage that was taken out on this home.
Original Mortgage
$151,152
Interest Rate
6.95%
Mortgage Type
FHA
Purchase Details
Closed on
Mar 19, 1991
Sold by
Duran Rose G
Bought by
Duran Ray
Create a Home Valuation Report for This Property
The Home Valuation Report is an in-depth analysis detailing your home's value as well as a comparison with similar homes in the area
Home Values in the Area
Average Home Value in this Area
Purchase History
| Date | Buyer | Sale Price | Title Company |
|---|---|---|---|
| Franco Hilario | $177,000 | Fidelity National Title Co | |
| Duran Ramon E | -- | Southland Title Corporation | |
| Medrano Tommy A | $153,000 | Southland Title Corporation | |
| Duran Ray | -- | Southland Title Corporation |
Source: Public Records
Mortgage History
| Date | Status | Borrower | Loan Amount |
|---|---|---|---|
| Open | Franco Hilario | $174,265 | |
| Previous Owner | Medrano Tommy A | $151,152 | |
| Closed | Franco Hilario | $5,310 |
Source: Public Records
Tax History
| Year | Tax Paid | Tax Assessment Tax Assessment Total Assessment is a certain percentage of the fair market value that is determined by local assessors to be the total taxable value of land and additions on the property. | Land | Improvement |
|---|---|---|---|---|
| 2025 | $4,390 | $296,363 | $170,915 | $125,448 |
| 2024 | $4,390 | $290,553 | $167,564 | $122,989 |
| 2023 | $4,269 | $284,857 | $164,279 | $120,578 |
| 2022 | $4,079 | $279,272 | $161,058 | $118,214 |
| 2021 | $3,967 | $273,797 | $157,900 | $115,897 |
| 2019 | $3,936 | $265,677 | $153,217 | $112,460 |
| 2018 | $3,716 | $260,468 | $150,213 | $110,255 |
| 2016 | $3,358 | $250,356 | $144,381 | $105,975 |
| 2015 | $3,308 | $246,597 | $142,213 | $104,384 |
| 2014 | $3,268 | $241,768 | $139,428 | $102,340 |
Source: Public Records
Map
Nearby Homes
- 9419 Beverly Blvd
- 4288 Rosemead Blvd Unit 25
- 4018 Amistad Ave
- 8835 Las Posas St
- 8939 Gallatin Rd Unit 16
- 9365 Via Azul
- 9367 Via Azul
- 9335 Via Azul
- 9329 Via Azul
- 9323 Via Azul
- 9327 Via Azul
- 4424 Calada Ave
- 9324 Via Azul
- 8509 Beverly Blvd Unit 76
- 8509 Beverly Blvd Unit 24
- 8509 Beverly Blvd Unit 74
- 8509 Beverly Blvd Unit 33
- 9318 Via Azul
- 9035 Hightree St
- 4660 Paramount Blvd
- 9329 Tilmont St
- 9317 Tilmont St
- 9333 Tilmont St
- 9307 Tilmont St
- 9328 Dork St
- 9316 Dork St
- 4331 Gangel Ave
- 9339 Tilmont St
- 9332 Dork St
- 9328 Tilmont St
- 9305 Tilmont St
- 4310 Durfee Ave
- 9334 Tilmont St
- 9342 Dork St
- 4337 Gangel Ave
- 9343 Tilmont St
- 4330 Durfee Ave
- 9340 Dork St
- 9306 Dork St
- 9338 Tilmont St
Your Personal Tour Guide
Ask me questions while you tour the home.