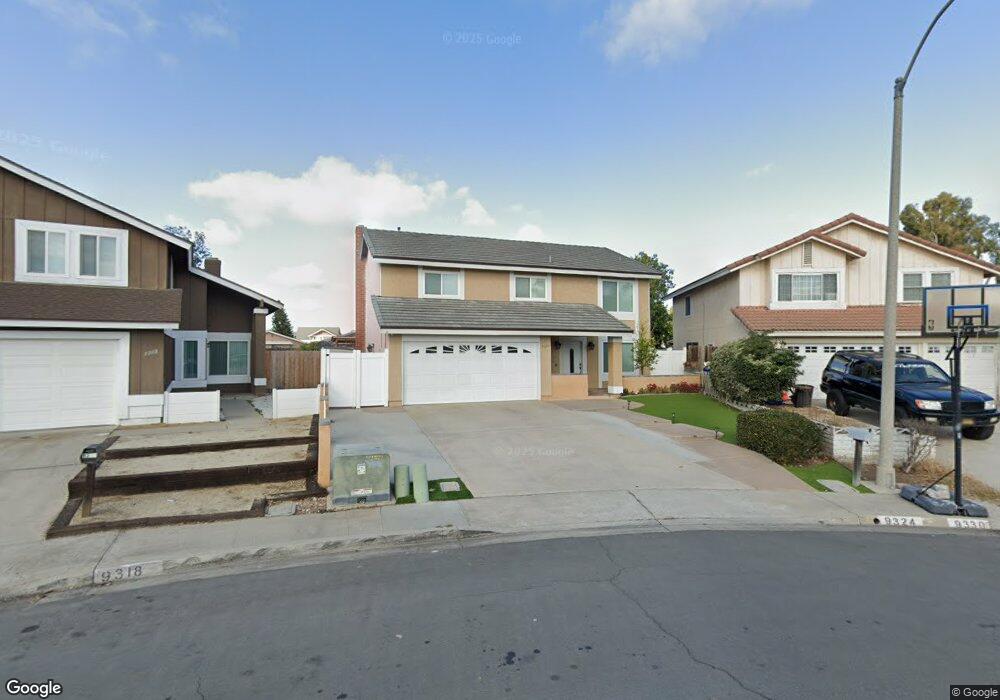
9324 Twin Mountain Cir San Diego, CA 92126
Mira Mesa NeighborhoodEstimated Value: $1,243,426 - $1,513,000
5
Beds
3
Baths
1,938
Sq Ft
$688/Sq Ft
Est. Value
About This Home
This home is located at 9324 Twin Mountain Cir, San Diego, CA 92126 and is currently estimated at $1,332,607, approximately $687 per square foot. 9324 Twin Mountain Cir is a home located in San Diego County with nearby schools including Hage Elementary School, Wangenheim Middle School, and Mira Mesa High School.
Ownership History
Date
Name
Owned For
Owner Type
Purchase Details
Closed on
Nov 1, 2017
Sold by
Brien Cathy O and Kothawala Ghani
Bought by
Nguyen Stanley and Khuc Phuong V
Current Estimated Value
Home Financials for this Owner
Home Financials are based on the most recent Mortgage that was taken out on this home.
Original Mortgage
$450,000
Outstanding Balance
$377,079
Interest Rate
3.85%
Mortgage Type
New Conventional
Estimated Equity
$955,528
Purchase Details
Closed on
Mar 2, 2007
Sold by
Kothawala Zakaria E
Bought by
Obrien Cathy and Kothawala Ghani
Purchase Details
Closed on
Feb 20, 2003
Sold by
Kothawala Zakaria E
Bought by
Kothawala Zakaria E
Home Financials for this Owner
Home Financials are based on the most recent Mortgage that was taken out on this home.
Original Mortgage
$200,000
Interest Rate
5.85%
Purchase Details
Closed on
Mar 6, 2001
Sold by
Kothawala Catherine M
Bought by
Kothawala Zakaria E
Create a Home Valuation Report for This Property
The Home Valuation Report is an in-depth analysis detailing your home's value as well as a comparison with similar homes in the area
Home Values in the Area
Average Home Value in this Area
Purchase History
| Date | Buyer | Sale Price | Title Company |
|---|---|---|---|
| Nguyen Stanley | $730,000 | Lawyers Title | |
| Obrien Cathy | -- | None Available | |
| Kothawala Zakaria E | -- | Fidelity National Title Co | |
| Kothawala Zakaria E | -- | -- |
Source: Public Records
Mortgage History
| Date | Status | Borrower | Loan Amount |
|---|---|---|---|
| Open | Nguyen Stanley | $450,000 | |
| Previous Owner | Kothawala Zakaria E | $200,000 |
Source: Public Records
Tax History Compared to Growth
Tax History
| Year | Tax Paid | Tax Assessment Tax Assessment Total Assessment is a certain percentage of the fair market value that is determined by local assessors to be the total taxable value of land and additions on the property. | Land | Improvement |
|---|---|---|---|---|
| 2025 | $9,967 | $830,608 | $348,922 | $481,686 |
| 2024 | $9,967 | $814,323 | $342,081 | $472,242 |
| 2023 | $9,745 | $798,357 | $335,374 | $462,983 |
| 2022 | $9,484 | $782,704 | $328,799 | $453,905 |
| 2021 | $9,417 | $767,357 | $322,352 | $445,005 |
| 2020 | $9,302 | $759,490 | $319,047 | $440,443 |
| 2019 | $9,134 | $744,599 | $312,792 | $431,807 |
| 2018 | $8,539 | $730,000 | $306,659 | $423,341 |
| 2017 | $2,876 | $242,313 | $101,791 | $140,522 |
| 2016 | $2,829 | $237,563 | $99,796 | $137,767 |
| 2015 | $2,788 | $233,995 | $98,297 | $135,698 |
| 2014 | $2,745 | $229,412 | $96,372 | $133,040 |
Source: Public Records
Map
Nearby Homes
- 9310 Galvin Ave Unit 15
- 10805 Eberly Ct
- 11091 Ice Skate Place Unit 20
- 10770 Black Mountain Rd Unit 220
- 10770 Black Mountain Rd
- 10771 Black Mountain Rd Unit 92
- 10771 Black Mountain Rd Unit 58
- 8943 Calliandra Rd
- 9471 Compass Point Dr S
- 11279 Pegasus Ave
- 9899 Scripps Westview Way Unit 243
- 9899 Scripps Westview Way Unit 244
- 10582 Caminito Glenellen
- 8727 Westmore Rd Unit 24
- 11394 Pegasus Ave
- 8686 Perseus Rd
- 9939 Erma Rd Unit 101
- 9929 Erma Rd Unit 102
- 8594 Summerdale Rd Unit 164
- 8595 Summerdale Rd Unit 170
- 9318 Twin Mountain Cir
- 9330 Twin Mountain Cir
- 9312 Twin Mountain Cir
- 9336 Twin Mountain Cir
- 9342 Twin Mountain Cir
- 9306 Twin Mountain Cir
- 9333 Twin Mountain Cir
- 10975 Janice Ct
- 10965 Jani Ct
- 10965 Janice Ct
- 9323 Twin Mountain Cir
- 9348 Twin Mountain Cir
- 10955 Janice Ct
- 10985 Janice Ct
- 10945 Janice Ct
- 9313 Twin Mountain Cir
- 9354 Twin Mountain Cir
- 10935 Janice Ct
- 9343 Twin Mountain Cir
- 9332 Galvin Ave