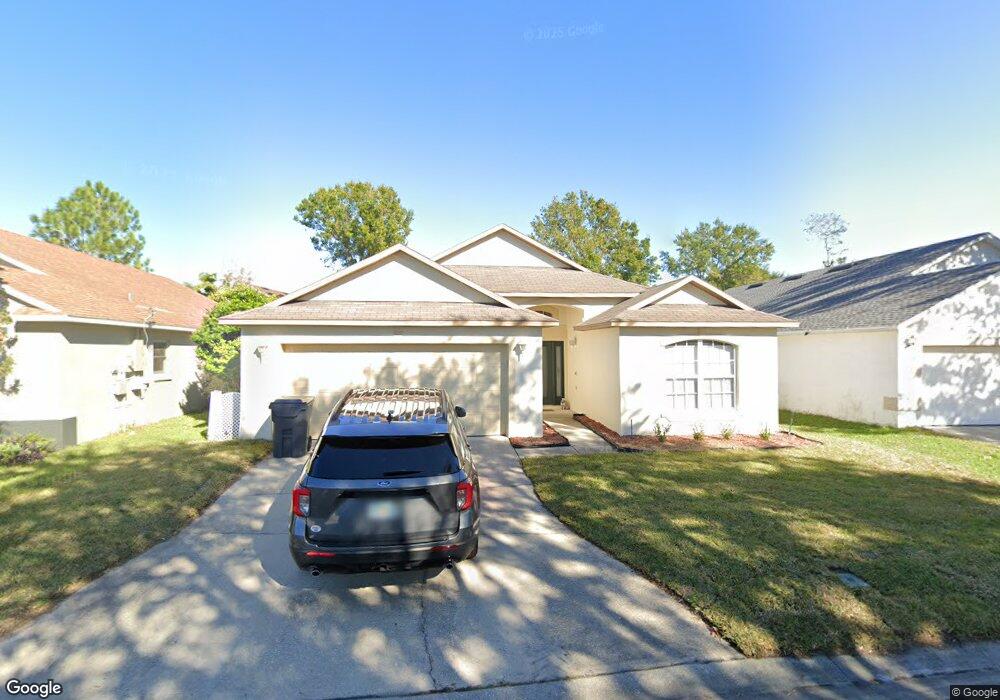
933 Cassia Dr Davenport, FL 33897
Estimated Value: $317,515 - $338,000
3
Beds
2
Baths
1,515
Sq Ft
$217/Sq Ft
Est. Value
About This Home
This home is located at 933 Cassia Dr, Davenport, FL 33897 and is currently estimated at $329,129, approximately $217 per square foot. 933 Cassia Dr is a home located in Polk County with nearby schools including Citrus Ridge Academy: a Civics Academy, Davenport School Of The Arts, and Dundee Elementary Academy.
Ownership History
Date
Name
Owned For
Owner Type
Purchase Details
Closed on
Nov 9, 2017
Sold by
2017 2 Ih Borrower Lp
Bought by
2017 2 Ih Borrower Lp
Current Estimated Value
Purchase Details
Closed on
Dec 11, 2012
Sold by
Gonzalez Lisa
Bought by
Thr Florida Lp
Purchase Details
Closed on
May 31, 2012
Sold by
Gonzalez Lisa
Bought by
Heffico and Trust #933
Purchase Details
Closed on
May 23, 2006
Sold by
Gonzalez Michael and Gonzalez Lisa
Bought by
Gonzalez Lisa
Home Financials for this Owner
Home Financials are based on the most recent Mortgage that was taken out on this home.
Original Mortgage
$208,250
Interest Rate
6.87%
Mortgage Type
Fannie Mae Freddie Mac
Purchase Details
Closed on
Sep 18, 2002
Sold by
American Heritage Hms Usa Inc
Bought by
Gonzalez Michael and Gonzalez Lisa
Home Financials for this Owner
Home Financials are based on the most recent Mortgage that was taken out on this home.
Original Mortgage
$124,134
Interest Rate
6.3%
Mortgage Type
FHA
Create a Home Valuation Report for This Property
The Home Valuation Report is an in-depth analysis detailing your home's value as well as a comparison with similar homes in the area
Home Values in the Area
Average Home Value in this Area
Purchase History
| Date | Buyer | Sale Price | Title Company |
|---|---|---|---|
| 2017 2 Ih Borrower Lp | -- | None Available | |
| Thr Florida Lp | $72,200 | Attorney | |
| Heffico | -- | Attorney | |
| Gonzalez Lisa | -- | Fidelity National Title Ins | |
| Gonzalez Michael | $126,200 | -- |
Source: Public Records
Mortgage History
| Date | Status | Borrower | Loan Amount |
|---|---|---|---|
| Previous Owner | Gonzalez Lisa | $208,250 | |
| Previous Owner | Gonzalez Michael | $124,134 |
Source: Public Records
Tax History Compared to Growth
Tax History
| Year | Tax Paid | Tax Assessment Tax Assessment Total Assessment is a certain percentage of the fair market value that is determined by local assessors to be the total taxable value of land and additions on the property. | Land | Improvement |
|---|---|---|---|---|
| 2025 | $3,581 | $236,641 | -- | -- |
| 2024 | $3,332 | $215,128 | -- | -- |
| 2023 | $3,332 | $195,571 | $0 | $0 |
| 2022 | $3,012 | $177,792 | $0 | $0 |
| 2021 | $2,689 | $161,629 | $39,000 | $122,629 |
| 2020 | $2,612 | $156,321 | $37,000 | $119,321 |
| 2018 | $2,378 | $139,276 | $35,000 | $104,276 |
| 2017 | $2,192 | $123,020 | $0 | $0 |
| 2016 | $2,096 | $111,836 | $0 | $0 |
| 2015 | $1,686 | $101,669 | $0 | $0 |
| 2014 | $1,676 | $92,426 | $0 | $0 |
Source: Public Records
Map
Nearby Homes
- 856 Cassia Dr
- 215 Elderberry Dr
- 326 Elderberry Dr
- 611 Old Bridge Cir
- 641 Old Bridge Cir Unit 68
- 620 Old Bridge Cir
- 456 Old Bridge Cir
- 226 Canna Dr
- 623 Elderberry Dr
- 154 Canna Dr
- 142 Plumoso Loop
- 177 Bella Verano Way
- 252 Elgin Blvd
- 172 Plumoso Loop
- 115 Canna Dr
- 219 Plumoso Loop
- 451 Montara Dr
- 928 Elderberry Dr
- 303 Plumoso Loop
- 253 Calabay Parc Blvd
- 923 Cassia Dr
- 943 Cassia Dr
- 111 Purslane Pass
- 121 Purslane Pass
- 101 Purslane Pass
- 953 Cassia Dr
- 131 Purslane Pass
- 932 Cassia Dr
- 942 Cassia Dr
- 903 Cassia Dr
- 912 Cassia Dr
- 952 Cassia Dr
- 141 Purslane Pass
- 902 Cassia Dr
- 857 Cassia Dr
- 962 Cassia Dr
- 151 Purslane Pass
- 110 Purslane Pass
- 238 Cassia Dr
- 847 Cassia Dr