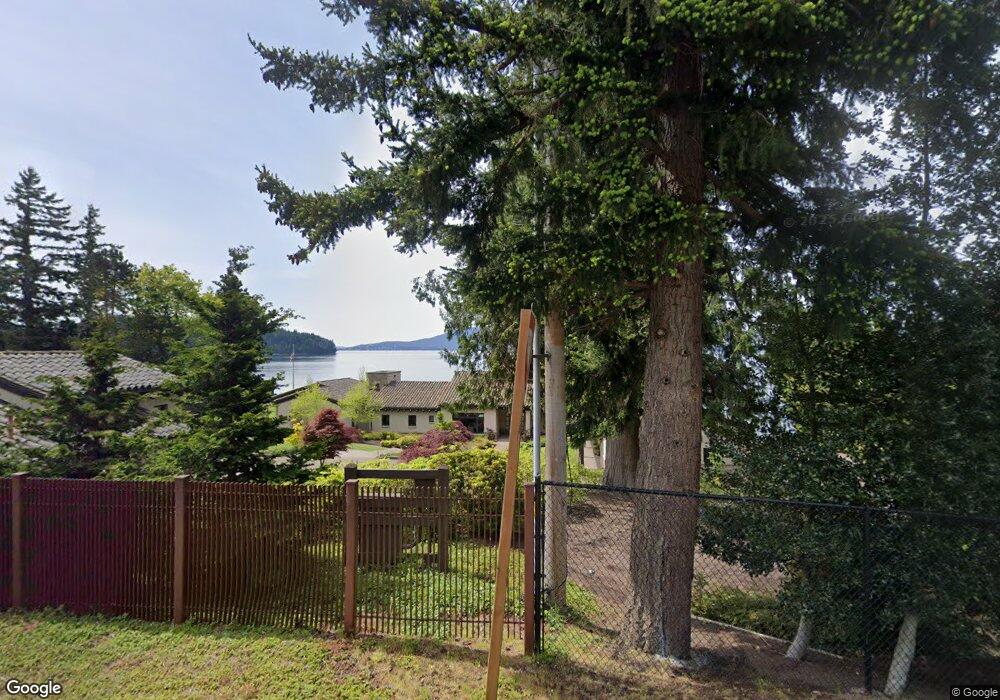
933 Chuckanut Shore Rd Bellingham, WA 98229
Estimated Value: $4,157,000 - $5,442,000
4
Beds
4
Baths
6,164
Sq Ft
$789/Sq Ft
Est. Value
About This Home
This home is located at 933 Chuckanut Shore Rd, Bellingham, WA 98229 and is currently estimated at $4,865,084, approximately $789 per square foot. 933 Chuckanut Shore Rd is a home located in Whatcom County with nearby schools including Happy Valley Elementary School, Fairhaven Middle School, and Sehome High School.
Ownership History
Date
Name
Owned For
Owner Type
Purchase Details
Closed on
Dec 29, 2017
Sold by
Kathryn J Haggen
Bought by
Pritchett Robert and Pritchett Audra
Current Estimated Value
Home Financials for this Owner
Home Financials are based on the most recent Mortgage that was taken out on this home.
Original Mortgage
$2,100,000
Outstanding Balance
$1,774,410
Interest Rate
3.99%
Estimated Equity
$3,090,674
Purchase Details
Closed on
Nov 2, 2017
Sold by
Haggen Kathryn J
Bought by
Pritchett Robert D and Pritchett Audra K
Home Financials for this Owner
Home Financials are based on the most recent Mortgage that was taken out on this home.
Original Mortgage
$2,100,000
Outstanding Balance
$1,774,410
Interest Rate
3.99%
Estimated Equity
$3,090,674
Purchase Details
Closed on
Apr 23, 2014
Sold by
Haggen Kathryn J
Bought by
Haggen Kathryn J
Create a Home Valuation Report for This Property
The Home Valuation Report is an in-depth analysis detailing your home's value as well as a comparison with similar homes in the area
Home Values in the Area
Average Home Value in this Area
Purchase History
| Date | Buyer | Sale Price | Title Company |
|---|---|---|---|
| Pritchett Robert | -- | -- | |
| Pritchett Robert D | $3,000,000 | Whatcom Land Title Co Inc | |
| Haggen Kathryn J | -- | None Available |
Source: Public Records
Mortgage History
| Date | Status | Borrower | Loan Amount |
|---|---|---|---|
| Open | Pritchett Robert | $2,100,000 | |
| Closed | Pritchett Robert | -- |
Source: Public Records
Tax History Compared to Growth
Tax History
| Year | Tax Paid | Tax Assessment Tax Assessment Total Assessment is a certain percentage of the fair market value that is determined by local assessors to be the total taxable value of land and additions on the property. | Land | Improvement |
|---|---|---|---|---|
| 2024 | $43,874 | $5,868,229 | $2,880,814 | $2,987,415 |
| 2023 | $43,874 | $5,239,659 | $2,664,595 | $2,575,064 |
| 2022 | $37,853 | $4,459,310 | $2,267,754 | $2,191,556 |
| 2021 | $33,728 | $3,596,314 | $1,828,883 | $1,767,431 |
| 2020 | $33,016 | $3,154,635 | $1,604,270 | $1,550,365 |
| 2019 | $35,084 | $2,994,433 | $1,522,800 | $1,471,633 |
| 2018 | $50,065 | $3,193,765 | $1,577,163 | $1,616,602 |
| 2017 | $44,257 | $3,883,228 | $1,625,860 | $2,257,368 |
| 2016 | $40,255 | $3,579,135 | $1,497,028 | $2,082,107 |
| 2015 | $39,547 | $3,409,561 | $1,432,612 | $1,976,949 |
| 2014 | -- | $3,249,680 | $1,365,619 | $1,884,061 |
| 2013 | -- | $3,040,935 | $1,288,320 | $1,752,615 |
Source: Public Records
Map
Nearby Homes
- 166 Soundview Rd
- 123 Hiline Rd
- 555 Whitecap Rd
- 291 Arbel Way
- 557 Whitecap Rd
- 251 Arbel Way
- 157 Chuckanut Crest Dr
- 2408 Sonora Ln
- 1697 Chuckanut Crest Dr
- 2404 Sonora Ln
- 697 Chuckanut Dr N
- 414 S Clarkwood Dr
- 1301 Broad St
- 2600 16th St
- 507 Lyla Ln
- 2701 Cody Cir Unit 203
- 425 Chuckanut Dr N Unit 29
- 2600 42nd
- 2608 S 42nd St
- 331 Chuckanut Dr N
- 951 Chuckanut Ln
- 959 Chuckanut Ln
- 919 Chuckanut Shore Rd
- 967 Chuckanut Ln
- 911 Chuckanut Shore Rd
- 933 Chuckanut Dr
- 919 Chuckanut Dr
- 961 Chuckanut Dr
- 973 Chuckanut Shore Rd
- 903 Chuckanut Shore Rd
- 981 Chuckanut Ln
- 897 Chuckanut Shore Rd
- 938 Chuckanut Dr
- 907 Chuckanut Dr
- 989 Chuckanut Ln
- 924 Chuckanut Dr
- 889 Chuckanut Shore Rd
- 972 Chuckanut Dr
- 942 Chuckanut Dr
- 964 Chuckanut Dr