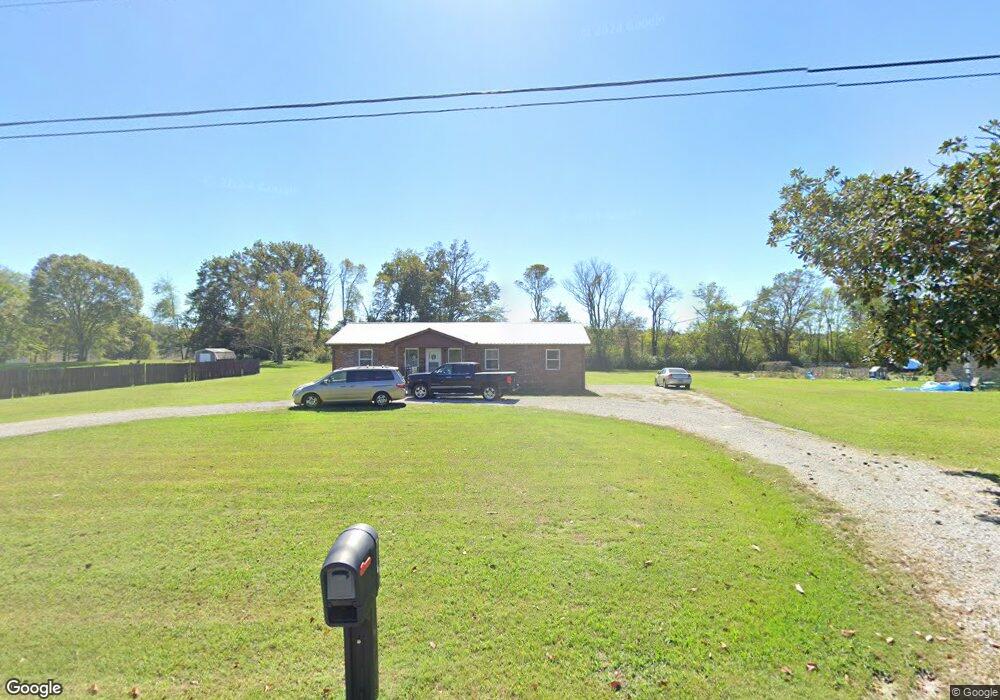
933 Cindy Dr Cookeville, TN 38506
Estimated Value: $252,772 - $290,000
--
Bed
2
Baths
1,404
Sq Ft
$192/Sq Ft
Est. Value
About This Home
This home is located at 933 Cindy Dr, Cookeville, TN 38506 and is currently estimated at $268,943, approximately $191 per square foot. 933 Cindy Dr is a home located in Putnam County with nearby schools including Cookeville High School, Algood Middle School, and Northeast Elementary School.
Ownership History
Date
Name
Owned For
Owner Type
Purchase Details
Closed on
Aug 12, 2022
Sold by
Sharon Williams
Bought by
Sorensen Kelly J
Current Estimated Value
Purchase Details
Closed on
Nov 13, 2019
Sold by
Koehler Sharon L
Bought by
Williams Sharon L
Purchase Details
Closed on
Sep 21, 1989
Bought by
Koettler Sharon L
Purchase Details
Closed on
May 26, 1989
Bought by
United States Of America Fha
Purchase Details
Closed on
Oct 20, 1986
Bought by
O'Connor Debra J
Create a Home Valuation Report for This Property
The Home Valuation Report is an in-depth analysis detailing your home's value as well as a comparison with similar homes in the area
Home Values in the Area
Average Home Value in this Area
Purchase History
| Date | Buyer | Sale Price | Title Company |
|---|---|---|---|
| Sorensen Kelly J | -- | None Listed On Document | |
| Williams Sharon L | -- | -- | |
| Koettler Sharon L | -- | -- | |
| United States Of America Fha | $39,500 | -- | |
| O'Connor Debra J | $4,500 | -- |
Source: Public Records
Tax History Compared to Growth
Tax History
| Year | Tax Paid | Tax Assessment Tax Assessment Total Assessment is a certain percentage of the fair market value that is determined by local assessors to be the total taxable value of land and additions on the property. | Land | Improvement |
|---|---|---|---|---|
| 2024 | $889 | $33,425 | $4,300 | $29,125 |
| 2023 | $889 | $33,425 | $4,300 | $29,125 |
| 2022 | $826 | $33,425 | $4,300 | $29,125 |
| 2021 | $826 | $33,425 | $4,300 | $29,125 |
| 2020 | $731 | $33,425 | $4,300 | $29,125 |
| 2019 | $731 | $24,975 | $4,300 | $20,675 |
| 2018 | $682 | $24,975 | $4,300 | $20,675 |
| 2017 | $682 | $24,975 | $4,300 | $20,675 |
| 2016 | $655 | $24,975 | $4,300 | $20,675 |
| 2015 | $698 | $24,900 | $5,200 | $19,700 |
| 2014 | $665 | $23,720 | $0 | $0 |
Source: Public Records
Map
Nearby Homes