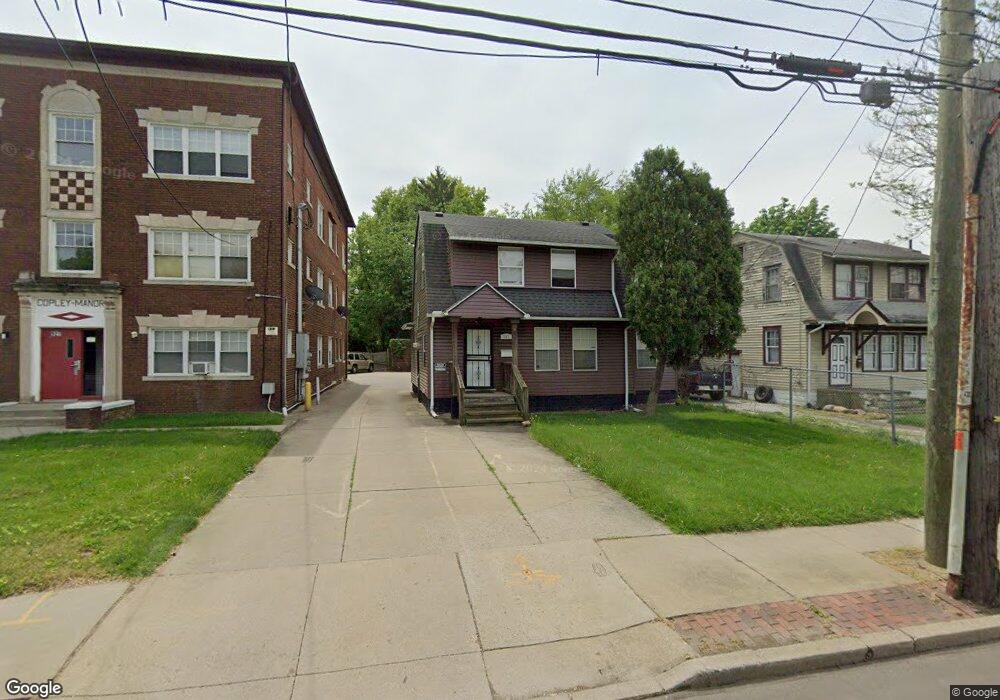
933 Copley Rd Akron, OH 44320
West Akron NeighborhoodEstimated Value: $77,000 - $112,000
3
Beds
2
Baths
738
Sq Ft
$131/Sq Ft
Est. Value
About This Home
This home is located at 933 Copley Rd, Akron, OH 44320 and is currently estimated at $96,667, approximately $130 per square foot. 933 Copley Rd is a home located in Summit County with nearby schools including St. Vincent Elementary School, Our Lady Of The Elms Elementary School, and Spring Garden Waldorf School.
Ownership History
Date
Name
Owned For
Owner Type
Purchase Details
Closed on
Oct 19, 2018
Sold by
Colvin Bobby R
Bought by
Hasselhof Soehnke
Current Estimated Value
Purchase Details
Closed on
Jan 10, 2007
Sold by
B R Colvin Inc
Bought by
Colvin Bobby R
Home Financials for this Owner
Home Financials are based on the most recent Mortgage that was taken out on this home.
Original Mortgage
$60,000
Interest Rate
6.27%
Mortgage Type
Purchase Money Mortgage
Purchase Details
Closed on
Sep 11, 2006
Sold by
Burke Phornell
Bought by
B R Colvin Inc
Purchase Details
Closed on
May 26, 2005
Sold by
Jackson Cynthia L
Bought by
Burke Phornell
Purchase Details
Closed on
Dec 12, 2001
Sold by
Estate Of Paul E Jackson Jr
Bought by
Jackson Cynthia L
Create a Home Valuation Report for This Property
The Home Valuation Report is an in-depth analysis detailing your home's value as well as a comparison with similar homes in the area
Home Values in the Area
Average Home Value in this Area
Purchase History
We collect this data history from publicly available records. To have your information removed, we recommend requesting removal directly through your county’s website.
| Date | Buyer | Sale Price | Title Company |
|---|---|---|---|
| Hasselhof Soehnke | $190,000 | None Available | |
| Colvin Bobby R | -- | Trident Title Agency Inc | |
| B R Colvin Inc | $28,500 | First American Title Ins Co | |
| Burke Phornell | $24,000 | Capital Land Title Agency In | |
| Burke Phornell | $24,000 | Capital Land Title Agency In | |
| Jackson Cynthia L | -- | -- |
Source: Public Records
Mortgage History
We collect this data history from publicly available records. To have your information removed, we recommend requesting removal directly through your county’s website.
| Date | Status | Borrower | Loan Amount |
|---|---|---|---|
| Previous Owner | Colvin Bobby R | $60,000 |
Source: Public Records
Tax History
| Year | Tax Paid | Tax Assessment Tax Assessment Total Assessment is a certain percentage of the fair market value that is determined by local assessors to be the total taxable value of land and additions on the property. | Land | Improvement |
|---|---|---|---|---|
| 2024 | $1,667 | $26,901 | $6,874 | $20,027 |
| 2023 | $1,667 | $26,901 | $6,874 | $20,027 |
| 2022 | $1,343 | $16,303 | $4,165 | $12,138 |
| 2021 | $1,345 | $16,303 | $4,165 | $12,138 |
| 2020 | $1,328 | $16,310 | $4,170 | $12,140 |
| 2019 | $1,152 | $11,020 | $4,120 | $6,900 |
| 2018 | $1,042 | $11,020 | $4,120 | $6,900 |
| 2017 | $1,117 | $11,020 | $4,120 | $6,900 |
| 2016 | $1,118 | $11,190 | $4,120 | $7,070 |
| 2015 | $1,117 | $11,190 | $4,120 | $7,070 |
| 2014 | $1,110 | $11,190 | $4,120 | $7,070 |
| 2013 | $1,199 | $12,690 | $4,120 | $8,570 |
Source: Public Records
Map
Nearby Homes
- 937 Copley Rd
- 927 Copley Rd
- 923 Copley Rd
- 506 Noah Ave
- 683 Storer Ave
- 687 Storer Ave
- 512 Noah Ave
- 913 Copley Rd
- 693 Storer Ave
- 516 Noah Ave
- 501 Noah Ave
- 909 Copley Rd
- 918 Copley Rd
- 918 Copley Rd Unit 5
- 918 Copley Rd Unit 4
- 918 Copley Rd Unit 2
- 918 Copley Rd Unit 3
- 918 Copley Rd Unit 7
- 918 Copley Rd Unit 9
- 697 Storer Ave
Your Personal Tour Guide
Ask me questions while you tour the home.