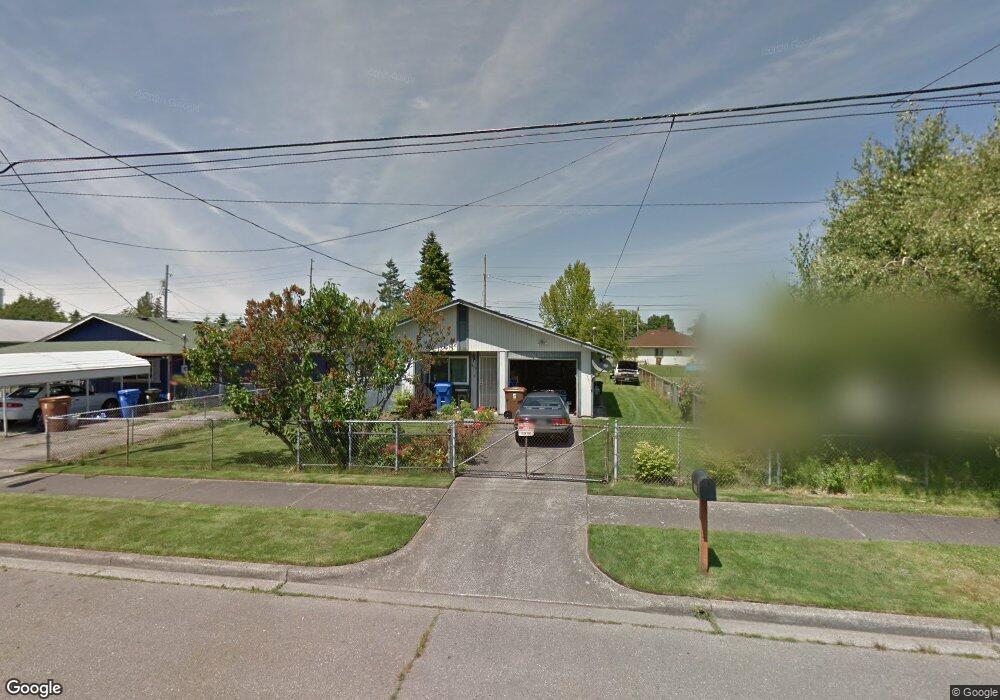
933 E 65th St Tacoma, WA 98404
Eastside NeighborhoodEstimated Value: $367,426 - $404,000
3
Beds
1
Bath
1,008
Sq Ft
$383/Sq Ft
Est. Value
About This Home
This home is located at 933 E 65th St, Tacoma, WA 98404 and is currently estimated at $386,107, approximately $383 per square foot. 933 E 65th St is a home located in Pierce County with nearby schools including Boze, First Creek Middle School, and Lincoln High School.
Ownership History
Date
Name
Owned For
Owner Type
Purchase Details
Closed on
Apr 29, 2008
Sold by
Culpepper Donna Delynne
Bought by
Swallow Michael
Current Estimated Value
Home Financials for this Owner
Home Financials are based on the most recent Mortgage that was taken out on this home.
Original Mortgage
$167,419
Outstanding Balance
$105,637
Interest Rate
5.81%
Mortgage Type
FHA
Estimated Equity
$280,470
Create a Home Valuation Report for This Property
The Home Valuation Report is an in-depth analysis detailing your home's value as well as a comparison with similar homes in the area
Home Values in the Area
Average Home Value in this Area
Purchase History
| Date | Buyer | Sale Price | Title Company |
|---|---|---|---|
| Swallow Michael | $170,047 | None Available |
Source: Public Records
Mortgage History
| Date | Status | Borrower | Loan Amount |
|---|---|---|---|
| Open | Swallow Michael | $167,419 |
Source: Public Records
Tax History
| Year | Tax Paid | Tax Assessment Tax Assessment Total Assessment is a certain percentage of the fair market value that is determined by local assessors to be the total taxable value of land and additions on the property. | Land | Improvement |
|---|---|---|---|---|
| 2025 | $289 | $361,900 | $191,900 | $170,000 |
| 2024 | $289 | $348,900 | $184,700 | $164,200 |
| 2023 | $289 | $327,200 | $177,500 | $149,700 |
| 2022 | $292 | $336,900 | $175,300 | $161,600 |
| 2021 | $323 | $241,900 | $108,700 | $133,200 |
| 2019 | $350 | $216,900 | $90,800 | $126,100 |
| 2018 | $373 | $191,300 | $73,700 | $117,600 |
| 2017 | $403 | $160,900 | $56,300 | $104,600 |
| 2016 | $1,952 | $122,200 | $42,700 | $79,500 |
| 2014 | $1,681 | $112,100 | $39,000 | $73,100 |
| 2013 | $1,681 | $99,300 | $34,700 | $64,600 |
Source: Public Records
Map
Nearby Homes