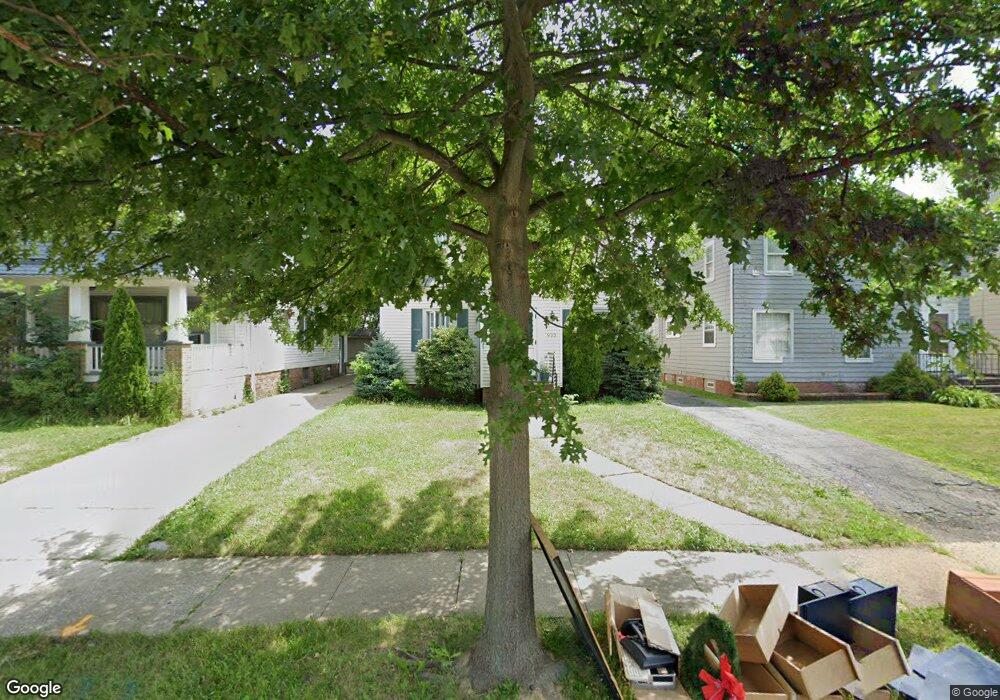
933 Elbon Rd Cleveland, OH 44121
Monticello-Noble NeighborhoodEstimated Value: $96,000 - $131,000
2
Beds
1
Bath
1,092
Sq Ft
$103/Sq Ft
Est. Value
About This Home
This home is located at 933 Elbon Rd, Cleveland, OH 44121 and is currently estimated at $112,976, approximately $103 per square foot. 933 Elbon Rd is a home located in Cuyahoga County with nearby schools including Oxford Elementary School, Monticello Middle School, and Cleveland Heights High School.
Ownership History
Date
Name
Owned For
Owner Type
Purchase Details
Closed on
Mar 2, 2009
Sold by
Fifth Third Bank Northeastern Ohio
Bought by
Dimario Wendylee
Current Estimated Value
Purchase Details
Closed on
Oct 9, 2008
Sold by
Johnson Thelma E and Johnson Kenneth W
Bought by
Fifth Third Bank Northeastern Ohio
Purchase Details
Closed on
May 13, 2003
Sold by
Johnson Thelma E
Bought by
Johnson Thelma E and Johnson Kenneth W
Purchase Details
Closed on
Nov 7, 2002
Sold by
Bailey Georgiann
Bought by
Johnson Thelma E
Purchase Details
Closed on
Jul 30, 2002
Sold by
Johnson Kenneth
Bought by
Bailey Georgian
Purchase Details
Closed on
Nov 7, 2001
Sold by
Corrigan Noreen B
Bought by
Johnson Kenneth W and Bailey Georgian
Purchase Details
Closed on
Sep 12, 1979
Sold by
Demooy Mary M
Bought by
Corrigan Noreen B
Purchase Details
Closed on
Jan 1, 1975
Bought by
Demooy Mary M
Create a Home Valuation Report for This Property
The Home Valuation Report is an in-depth analysis detailing your home's value as well as a comparison with similar homes in the area
Home Values in the Area
Average Home Value in this Area
Purchase History
| Date | Buyer | Sale Price | Title Company |
|---|---|---|---|
| Dimario Wendylee | $11,003 | Fidelity Land Title Agency O | |
| Fifth Third Bank Northeastern Ohio | $31,000 | None Available | |
| Johnson Thelma E | -- | -- | |
| Johnson Thelma E | -- | -- | |
| Bailey Georgian | $4,000 | -- | |
| Johnson Kenneth W | $54,000 | Approved Statewide Title Age | |
| Corrigan Noreen B | $37,000 | -- | |
| Demooy Mary M | -- | -- |
Source: Public Records
Tax History Compared to Growth
Tax History
| Year | Tax Paid | Tax Assessment Tax Assessment Total Assessment is a certain percentage of the fair market value that is determined by local assessors to be the total taxable value of land and additions on the property. | Land | Improvement |
|---|---|---|---|---|
| 2024 | $2,732 | $31,115 | $8,715 | $22,400 |
| 2023 | $2,116 | $18,660 | $4,940 | $13,720 |
| 2022 | $2,105 | $18,660 | $4,940 | $13,720 |
| 2021 | $2,065 | $18,660 | $4,940 | $13,720 |
| 2020 | $2,058 | $16,800 | $4,450 | $12,360 |
| 2019 | $1,949 | $48,000 | $12,700 | $35,300 |
| 2018 | $1,950 | $16,800 | $4,450 | $12,360 |
| 2017 | $1,123 | $8,720 | $4,520 | $4,200 |
| 2016 | $1,121 | $8,720 | $4,520 | $4,200 |
| 2015 | $1,268 | $8,720 | $4,520 | $4,200 |
| 2014 | $1,268 | $10,500 | $5,460 | $5,040 |
Source: Public Records
Map
Nearby Homes
- 967 Pembrook Rd
- 990 Pembrook Rd
- 901 Woodview Rd
- 888 Medford Rd
- 971 Rushleigh Rd
- 891 Medford Rd
- 1005 Woodview Rd
- 915 Clarence Rd
- 986 Woodview Rd
- 999 Rushleigh Rd
- 3451 Hartwood Rd
- 1033 Rushleigh Rd
- 931 Yellowstone Rd
- 1058 Pembrook Rd
- 916 Whitby Rd
- 1064 Elbon Rd
- 2400 Noble Rd
- 1068 Elbon Rd
- 3411 Hartwood Rd
- 2440 Noble Rd Unit 208