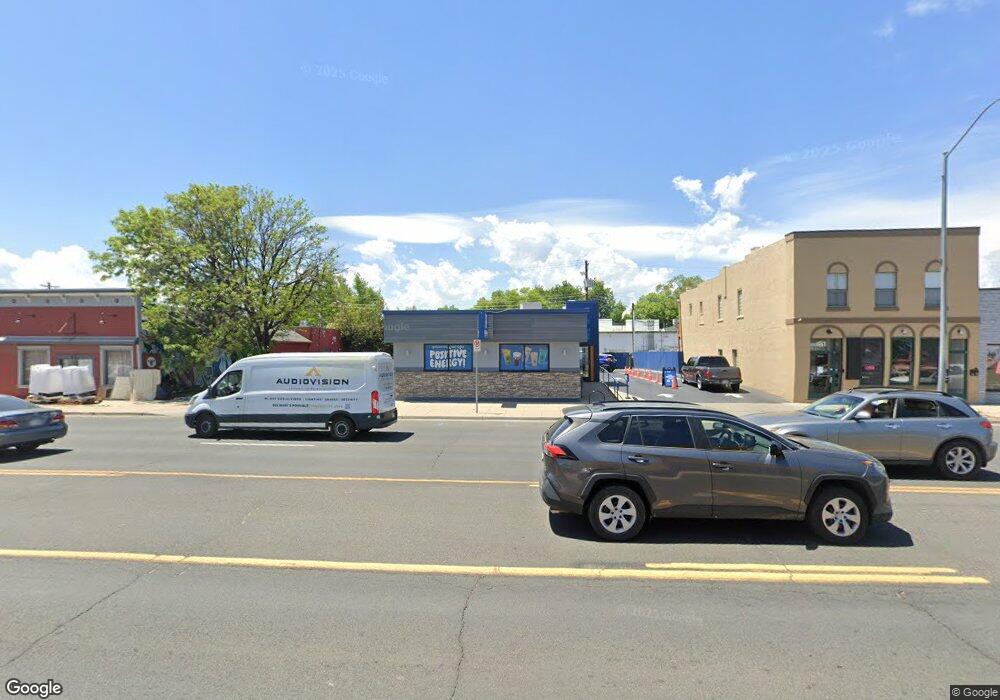
933 Main St Longmont, CO 80501
Business District NeighborhoodEstimated Value: $432,932
Studio
--
Bath
1,232
Sq Ft
$351/Sq Ft
Est. Value
About This Home
This home is located at 933 Main St, Longmont, CO 80501 and is currently estimated at $432,932, approximately $351 per square foot. 933 Main St is a home located in Boulder County with nearby schools including Mountain View Elementary School, Longs Peak Middle School, and Longmont High School.
Ownership History
Date
Name
Owned For
Owner Type
Purchase Details
Closed on
Dec 15, 2017
Sold by
Hwh Enterprise Llc
Bought by
Bb Holdtings Llc
Current Estimated Value
Purchase Details
Closed on
Oct 28, 2017
Sold by
Hwh Enterprises Llc
Bought by
Bb Holdiings Llc
Purchase Details
Closed on
Jan 6, 1989
Bought by
H W H Enterprises
Purchase Details
Closed on
May 25, 1957
Bought by
H W H Enterprises
Create a Home Valuation Report for This Property
The Home Valuation Report is an in-depth analysis detailing your home's value as well as a comparison with similar homes in the area
Home Values in the Area
Average Home Value in this Area
Purchase History
| Date | Buyer | Sale Price | Title Company |
|---|---|---|---|
| Bb Holdtings Llc | $715,000 | Stewart Title | |
| Bb Holdiings Llc | $299,000 | Guardian Title | |
| H W H Enterprises | $65,000 | -- | |
| H W H Enterprises | -- | -- |
Source: Public Records
Tax History
| Year | Tax Paid | Tax Assessment Tax Assessment Total Assessment is a certain percentage of the fair market value that is determined by local assessors to be the total taxable value of land and additions on the property. | Land | Improvement |
|---|---|---|---|---|
| 2025 | $17,211 | $206,442 | $95,688 | $110,754 |
| 2024 | $17,211 | $206,442 | $95,688 | $110,754 |
| 2023 | $16,976 | $179,927 | $107,359 | $80,938 |
| 2022 | $20,605 | $208,220 | $71,920 | $136,300 |
| 2021 | $20,288 | $208,220 | $71,920 | $136,300 |
| 2020 | $19,747 | $203,290 | $71,920 | $131,370 |
| 2019 | $19,436 | $203,290 | $71,920 | $131,370 |
| 2018 | $14,457 | $152,195 | $42,621 | $109,574 |
| 2017 | $14,260 | $152,195 | $42,621 | $109,574 |
| 2016 | $11,005 | $115,130 | $34,539 | $80,591 |
| 2015 | $10,487 | $115,130 | $43,500 | $71,630 |
| 2014 | $10,753 | $115,130 | $43,500 | $71,630 |
Source: Public Records
Map
Nearby Homes
- 824 Kimbark St
- 820 Kimbark St Unit B
- 1117 Collyer St
- 832 Gay St
- 1117 Atwood St
- 619 Pratt St
- 1230 Emery St
- 1232 Emery St
- 725 Gay St
- 1219 Atwood St
- 845 Martin St
- 10 9th Ave Unit 18
- 830 Martin St
- 536 Atwood St
- 1225 Baker St
- 1206 Aspen St
- 1403 Emery St
- 1402 9th Ave
- 409 Terry St Unit B
- 400 Emery St Unit 202
Your Personal Tour Guide
Ask me questions while you tour the home.