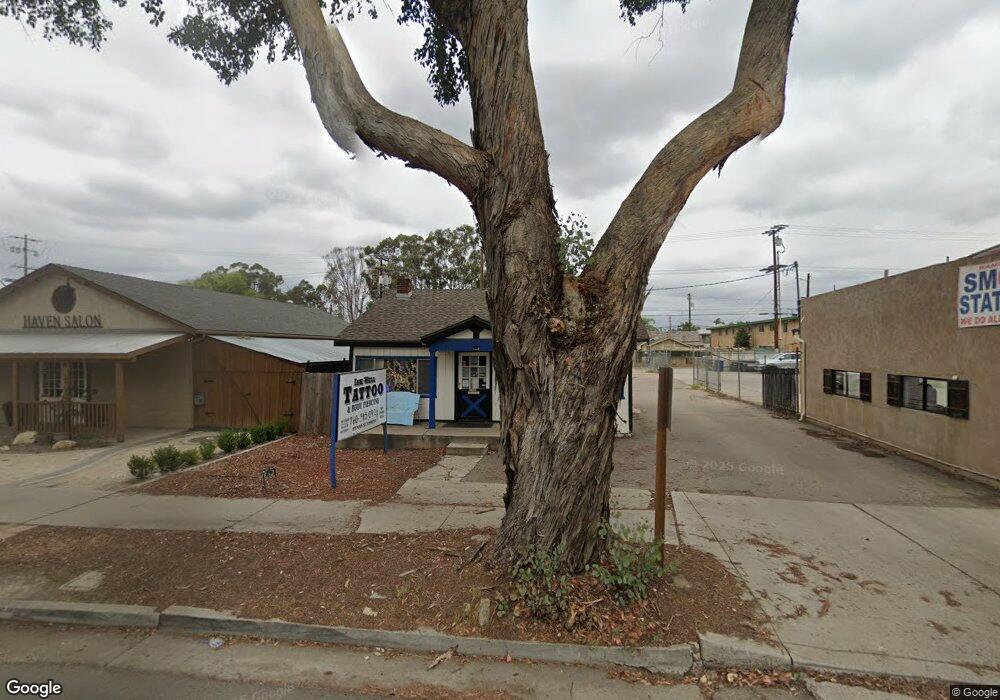
933 Main St Ramona, CA 92065
Estimated Value: $450,000 - $613,000
Studio
1
Bath
780
Sq Ft
$679/Sq Ft
Est. Value
About This Home
This home is located at 933 Main St, Ramona, CA 92065 and is currently estimated at $529,955, approximately $679 per square foot. 933 Main St is a home located in San Diego County with nearby schools including Ramona Elementary School, Olive Peirce Middle School, and Ramona High School.
Ownership History
Date
Name
Owned For
Owner Type
Purchase Details
Closed on
Jun 27, 2013
Sold by
Lobe Adam M
Bought by
Pacheco Benjamin
Current Estimated Value
Purchase Details
Closed on
Nov 27, 2000
Sold by
Mccune Family Trust 09-08-98 and Nancy C
Bought by
Lobe Adam M
Home Financials for this Owner
Home Financials are based on the most recent Mortgage that was taken out on this home.
Original Mortgage
$100,000
Interest Rate
7.86%
Create a Home Valuation Report for This Property
The Home Valuation Report is an in-depth analysis detailing your home's value as well as a comparison with similar homes in the area
Home Values in the Area
Average Home Value in this Area
Purchase History
| Date | Buyer | Sale Price | Title Company |
|---|---|---|---|
| Pacheco Benjamin | $250,000 | Fidelity National Title | |
| Lobe Adam M | $150,000 | New Century Title |
Source: Public Records
Mortgage History
| Date | Status | Borrower | Loan Amount |
|---|---|---|---|
| Previous Owner | Lobe Adam M | $100,000 |
Source: Public Records
Tax History
| Year | Tax Paid | Tax Assessment Tax Assessment Total Assessment is a certain percentage of the fair market value that is determined by local assessors to be the total taxable value of land and additions on the property. | Land | Improvement |
|---|---|---|---|---|
| 2025 | $3,399 | $306,454 | $245,166 | $61,288 |
| 2024 | $3,399 | $300,446 | $240,359 | $60,087 |
| 2023 | $3,141 | $294,556 | $235,647 | $58,909 |
| 2022 | $3,282 | $288,781 | $231,027 | $57,754 |
| 2021 | $3,231 | $283,120 | $226,498 | $56,622 |
| 2020 | $3,203 | $280,218 | $224,176 | $56,042 |
| 2019 | $3,130 | $274,725 | $219,781 | $54,944 |
| 2018 | $3,049 | $269,339 | $215,472 | $53,867 |
| 2017 | $2,992 | $264,059 | $211,248 | $52,811 |
| 2016 | $2,935 | $258,882 | $207,106 | $51,776 |
| 2015 | $2,888 | $254,995 | $203,996 | $50,999 |
| 2014 | $2,824 | $250,000 | $200,000 | $50,000 |
Source: Public Records
Map
Nearby Homes
Your Personal Tour Guide
Ask me questions while you tour the home.