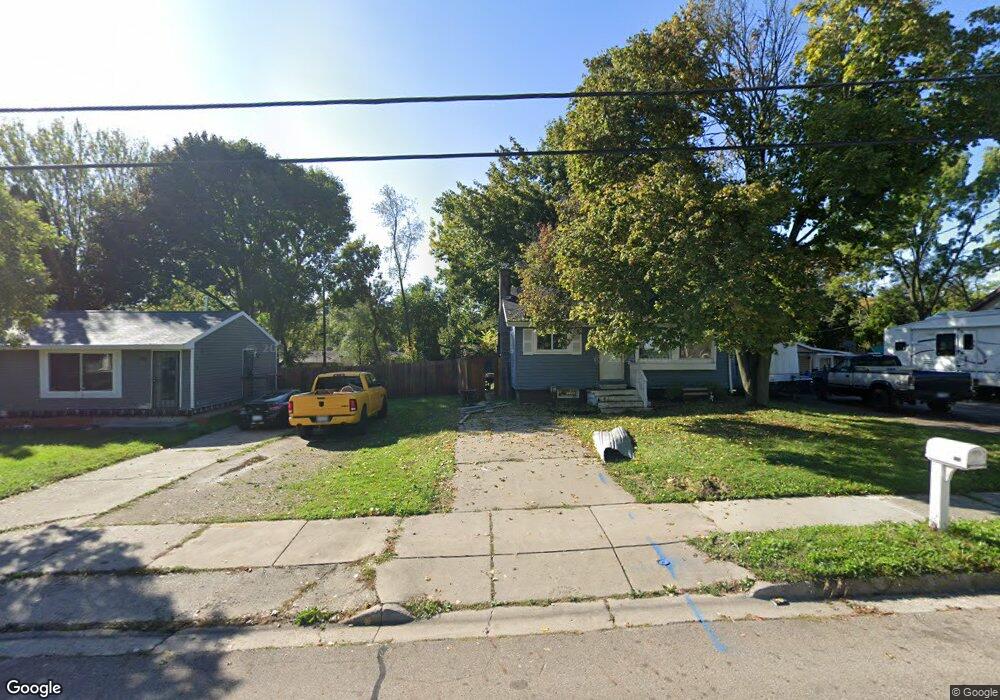
933 Reo Rd Lansing, MI 48910
Old Everett NeighborhoodEstimated Value: $76,969 - $133,000
2
Beds
1
Bath
572
Sq Ft
$168/Sq Ft
Est. Value
About This Home
This home is located at 933 Reo Rd, Lansing, MI 48910 and is currently estimated at $95,992, approximately $167 per square foot. 933 Reo Rd is a home located in Ingham County with nearby schools including Reo Elementary School, Attwood School, and Everett High School.
Ownership History
Date
Name
Owned For
Owner Type
Purchase Details
Closed on
May 10, 2013
Sold by
Summit Community Bank
Bought by
James Demetris
Current Estimated Value
Purchase Details
Closed on
Apr 4, 2013
Sold by
Benham Melissa
Bought by
Summit Community Bank
Purchase Details
Closed on
Mar 10, 2013
Sold by
Central Michigan Property Group Llc
Bought by
Benham Craig and Benham Deneen
Purchase Details
Closed on
Mar 1, 2013
Sold by
Benham Craig and Benham Deneen
Bought by
Summit Community Bank
Purchase Details
Closed on
Oct 11, 2007
Sold by
Swank Paul
Bought by
Wells Fargo Bank Na and First Franklin Mortgage Loan Trust 2006-
Purchase Details
Closed on
Aug 11, 2006
Sold by
Erzuah Ebenezer and Erzuah Paulette
Bought by
Swank Paul
Home Financials for this Owner
Home Financials are based on the most recent Mortgage that was taken out on this home.
Original Mortgage
$61,500
Interest Rate
9.95%
Mortgage Type
Stand Alone First
Purchase Details
Closed on
Dec 18, 2003
Sold by
Leist Martha M and Barner Mary E
Bought by
Citibank Na
Create a Home Valuation Report for This Property
The Home Valuation Report is an in-depth analysis detailing your home's value as well as a comparison with similar homes in the area
Home Values in the Area
Average Home Value in this Area
Purchase History
| Date | Buyer | Sale Price | Title Company |
|---|---|---|---|
| James Demetris | $8,000 | None Available | |
| Summit Community Bank | -- | None Available | |
| Benham Craig | -- | None Available | |
| Summit Community Bank | -- | None Available | |
| Wells Fargo Bank Na | $43,949 | None Available | |
| Swank Paul | $61,500 | None Available | |
| Citibank Na | $41,650 | -- |
Source: Public Records
Mortgage History
| Date | Status | Borrower | Loan Amount |
|---|---|---|---|
| Previous Owner | Swank Paul | $61,500 |
Source: Public Records
Tax History
| Year | Tax Paid | Tax Assessment Tax Assessment Total Assessment is a certain percentage of the fair market value that is determined by local assessors to be the total taxable value of land and additions on the property. | Land | Improvement |
|---|---|---|---|---|
| 2025 | $6,341 | $29,700 | $4,600 | $25,100 |
| 2024 | $55 | $22,500 | $4,600 | $17,900 |
| 2023 | $3,464 | $19,500 | $4,600 | $14,900 |
| 2022 | $3,149 | $16,500 | $3,500 | $13,000 |
| 2021 | $1,599 | $15,300 | $3,200 | $12,100 |
| 2020 | $1,249 | $14,500 | $3,200 | $11,300 |
| 2019 | $1,865 | $14,300 | $3,200 | $11,100 |
| 2018 | $1,008 | $12,500 | $3,200 | $9,300 |
| 2017 | $969 | $12,500 | $3,200 | $9,300 |
| 2016 | $3,294 | $12,300 | $3,200 | $9,100 |
| 2015 | $3,294 | $11,800 | $6,441 | $5,359 |
| 2014 | $3,294 | $11,700 | $9,202 | $2,498 |
Source: Public Records
Map
Nearby Homes
- 4907 Burchfield Ave
- 4414 S Martin Luther King jr Blvd
- 4926 Burchfield Ave
- 4731 Palmer St
- 4125 Lowcroft Ave
- 600 W Cavanaugh Rd
- 1215 S Briarfield Dr
- 0 W Jolly Rd
- 1113 Eaton Ct
- 1301 S Briarfield Dr
- 1420 Reo Rd
- 1429 Pierce Rd
- 0 Burchfield Dr
- 3815 Walton Dr
- 419 W Jolly Rd
- 3705 Burchfield Dr
- 1319 Hillcrest St
- 5009 Kessler Dr
- 221 W Everettdale Ave
- 3723 Weger Place
Your Personal Tour Guide
Ask me questions while you tour the home.