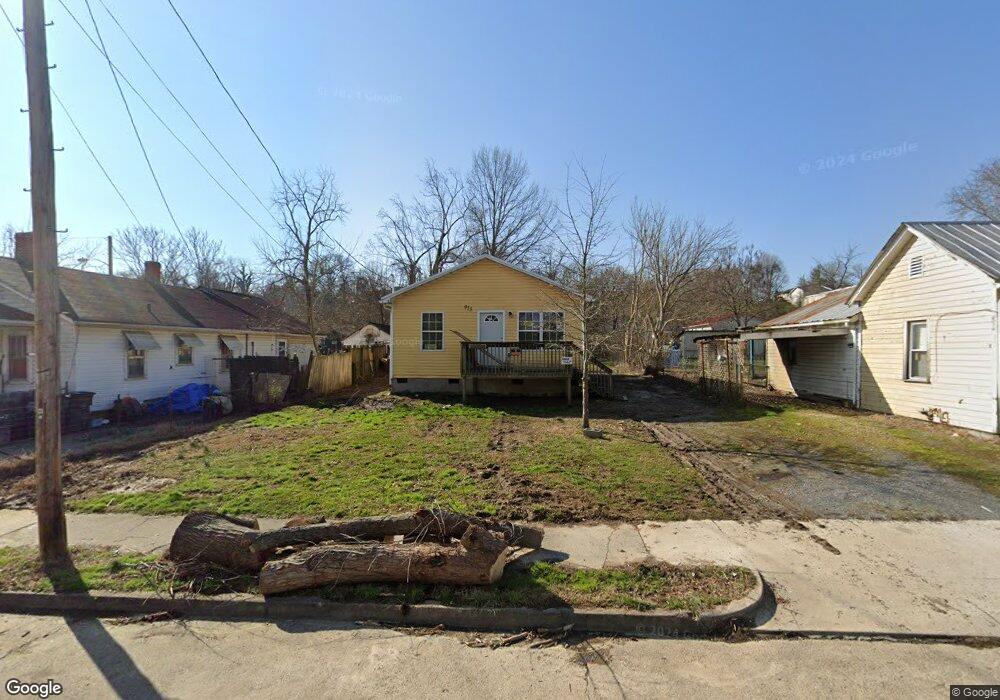
933 Robertson St Kingsport, TN 37660
Estimated Value: $119,000 - $155,000
--
Bed
1
Bath
828
Sq Ft
$164/Sq Ft
Est. Value
About This Home
This home is located at 933 Robertson St, Kingsport, TN 37660 and is currently estimated at $135,863, approximately $164 per square foot. 933 Robertson St is a home located in Sullivan County with nearby schools including Andrew Jackson Elementary School, John Sevier Middle School, and Ross N. Robinson Middle School.
Ownership History
Date
Name
Owned For
Owner Type
Purchase Details
Closed on
Feb 21, 2024
Sold by
Barrett Josh
Bought by
Barrett Investments Llc
Current Estimated Value
Purchase Details
Closed on
Jul 21, 2023
Sold by
Jennelle Katharine
Bought by
Barrett Josh
Purchase Details
Closed on
Nov 17, 2016
Sold by
Kappalachia Svc Project Inc
Bought by
Hartsook Teddy and Penley Hartsook Melissa
Purchase Details
Closed on
Sep 29, 2016
Sold by
Friends And Neighbors Inc
Bought by
Appalachia Svc Project Inc
Purchase Details
Closed on
Aug 9, 2013
Sold by
Greater Kingsport Alliance
Bought by
Friends And Neighbors Inc
Purchase Details
Closed on
Dec 7, 2009
Sold by
Stewart Jimmy Lee
Bought by
Greater Kingsport Alliance
Purchase Details
Closed on
Jan 15, 1993
Purchase Details
Closed on
Jul 21, 1992
Create a Home Valuation Report for This Property
The Home Valuation Report is an in-depth analysis detailing your home's value as well as a comparison with similar homes in the area
Home Values in the Area
Average Home Value in this Area
Purchase History
| Date | Buyer | Sale Price | Title Company |
|---|---|---|---|
| Barrett Investments Llc | -- | None Listed On Document | |
| Barrett Investments Llc | -- | None Listed On Document | |
| Barrett Josh | $18,000 | None Listed On Document | |
| Hartsook Teddy | $3,600 | -- | |
| Appalachia Svc Project Inc | $3,600 | -- | |
| Friends And Neighbors Inc | $4,500 | -- | |
| Greater Kingsport Alliance | $8,000 | -- | |
| -- | $30,000 | -- | |
| -- | $14,000 | -- |
Source: Public Records
Tax History Compared to Growth
Tax History
| Year | Tax Paid | Tax Assessment Tax Assessment Total Assessment is a certain percentage of the fair market value that is determined by local assessors to be the total taxable value of land and additions on the property. | Land | Improvement |
|---|---|---|---|---|
| 2024 | -- | $23,650 | $3,100 | $20,550 |
| 2023 | $1,042 | $23,650 | $3,100 | $20,550 |
| 2022 | $1,042 | $23,650 | $3,100 | $20,550 |
| 2021 | $1,013 | $23,650 | $3,100 | $20,550 |
| 2020 | $586 | $23,650 | $3,100 | $20,550 |
| 2019 | $1,057 | $22,800 | $3,100 | $19,700 |
| 2018 | $1,031 | $22,800 | $3,100 | $19,700 |
| 2017 | $1,031 | $22,800 | $3,100 | $19,700 |
| 2016 | $424 | $17,550 | $1,125 | $16,425 |
| 2014 | $49 | $1,125 | $0 | $0 |
Source: Public Records
Map
Nearby Homes
- 1005 Robertson St
- 925 Dorothy St
- 1010 Gibson Mill Rd
- 1026 Robertson St
- 1014 Gibson Mill Rd
- 1041 Robertson St
- 409 Rose St
- 122 E Park Dr
- 924 Campbell St
- 146 E Park Dr
- 813 Watauga St
- 1121 Watauga St
- 801 Watauga St
- 1122 Catawba St
- 513 Granada Pvt Ct
- 605 Myrtle St
- 142 W Wanola Ave
- 1235 Linville St
- 809 Yadkin St
- 201 W Wanola Ave
- 929 Robertson St
- 937 Robertson St
- 925 Robertson St
- 938 Dorothy St
- 1001 Robertson St
- 921 Robertson St
- 934 Dorothy St
- 938 Robertson St
- 930 Dorothy St
- 1006 Dorothy St
- 930 Robertson St
- 926 Dorothy St
- 1010 Dorothy St
- 926 Robertson St
- 1002 Robertson St
- 922 Dorothy St
- 922 Robertson St
- 1009 Robertson St
- 918 Robertson St
- 1006 Robertson St