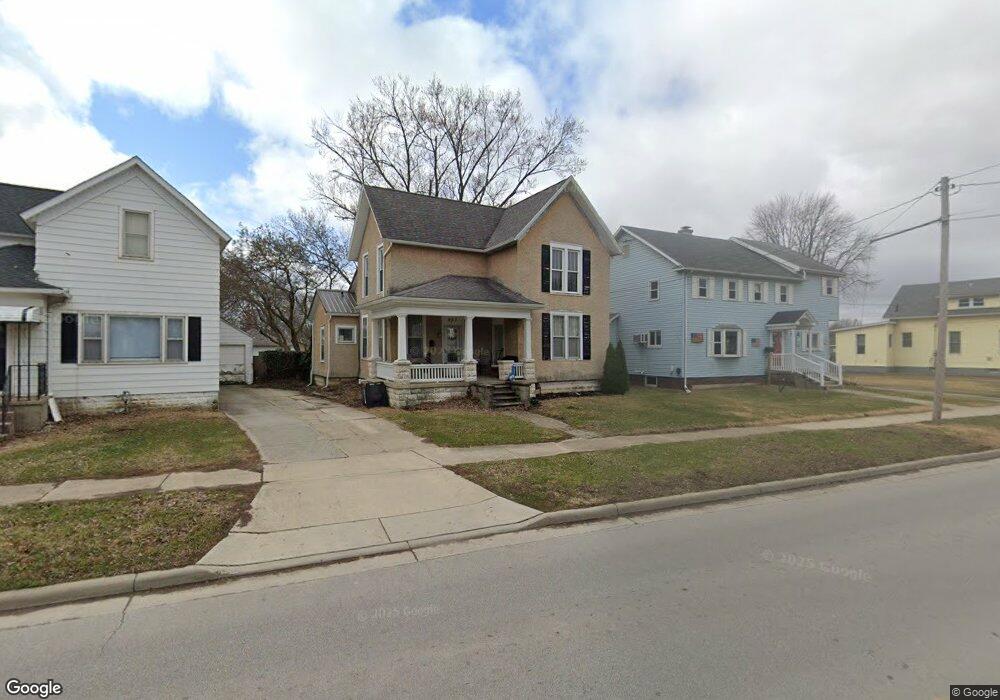
933 W Main Cross St Findlay, OH 45840
Estimated Value: $146,581 - $206,000
3
Beds
1
Bath
1,604
Sq Ft
$107/Sq Ft
Est. Value
About This Home
This home is located at 933 W Main Cross St, Findlay, OH 45840 and is currently estimated at $171,395, approximately $106 per square foot. 933 W Main Cross St is a home located in Hancock County with nearby schools including Lincoln Elementary School, Donnell Middle School, and Findlay High School.
Ownership History
Date
Name
Owned For
Owner Type
Purchase Details
Closed on
Aug 17, 2018
Sold by
Rader April A
Bought by
Schroeder Roger L and Schroeder Debra D
Current Estimated Value
Purchase Details
Closed on
Feb 26, 2016
Sold by
Dorothy I Bender
Bought by
Rader April
Home Financials for this Owner
Home Financials are based on the most recent Mortgage that was taken out on this home.
Original Mortgage
$74,000
Interest Rate
3.62%
Purchase Details
Closed on
Dec 23, 2010
Sold by
Bender Douglas J
Bought by
Bender Dorothy I
Purchase Details
Closed on
Aug 20, 2009
Sold by
Fifth Third Mortgage Company
Bought by
Bender Douglas J
Purchase Details
Closed on
Jul 13, 2009
Sold by
Tyson Tommy
Bought by
Fifth Third Mortgage Company
Purchase Details
Closed on
Jul 3, 2001
Sold by
Est Philip R Brooks
Bought by
Tyson Tommy L and Crawford Karen E
Home Financials for this Owner
Home Financials are based on the most recent Mortgage that was taken out on this home.
Original Mortgage
$69,000
Interest Rate
7.18%
Mortgage Type
New Conventional
Create a Home Valuation Report for This Property
The Home Valuation Report is an in-depth analysis detailing your home's value as well as a comparison with similar homes in the area
Home Values in the Area
Average Home Value in this Area
Purchase History
| Date | Buyer | Sale Price | Title Company |
|---|---|---|---|
| Schroeder Roger L | $96,500 | Mid Am Title | |
| Rader April | -- | -- | |
| Bender Dorothy I | -- | None Available | |
| Bender Douglas J | $27,000 | Freibert Title Group Llc | |
| Fifth Third Mortgage Company | $20,000 | Attorney | |
| Tyson Tommy L | $69,000 | -- |
Source: Public Records
Mortgage History
| Date | Status | Borrower | Loan Amount |
|---|---|---|---|
| Previous Owner | Rader April | $74,000 | |
| Previous Owner | Rader April | -- | |
| Previous Owner | Tyson Tommy L | $69,000 |
Source: Public Records
Tax History Compared to Growth
Tax History
| Year | Tax Paid | Tax Assessment Tax Assessment Total Assessment is a certain percentage of the fair market value that is determined by local assessors to be the total taxable value of land and additions on the property. | Land | Improvement |
|---|---|---|---|---|
| 2024 | $1,357 | $37,240 | $5,580 | $31,660 |
| 2023 | $1,360 | $37,240 | $5,580 | $31,660 |
| 2022 | $1,355 | $37,240 | $5,580 | $31,660 |
| 2021 | $1,184 | $28,340 | $5,590 | $22,750 |
| 2020 | $1,184 | $28,340 | $5,590 | $22,750 |
| 2019 | $1,160 | $28,340 | $5,590 | $22,750 |
| 2018 | $1,043 | $23,370 | $4,590 | $18,780 |
| 2017 | $1,016 | $23,370 | $4,590 | $18,780 |
| 2016 | $1,011 | $23,370 | $4,590 | $18,780 |
| 2015 | $865 | $19,240 | $4,590 | $14,650 |
| 2014 | $865 | $19,240 | $4,590 | $14,650 |
| 2012 | $873 | $19,240 | $4,590 | $14,650 |
Source: Public Records
Map
Nearby Homes
- 407 Washington St
- 514 Liberty St
- 419 W Lincoln St
- 720 S West St
- 512 N Cory St
- 0 Canadian Way Unit 20253551
- 0 Canadian Way Unit 6135400
- 416 1/2 Lima Ave
- 412 Lima Ave
- 224 Defiance Ave
- 225 Lima Ave
- 425 Nevada Ln
- 1005 Broad Ave
- 535 Palm Dr
- 706 N Cory St
- 213 Cherry St
- 1115 Liberty St
- 0 Waterford Way Lot 78 Unit 6089639
- 533 Davis St
- 829 Maple Ave
- 929 W Main Cross St
- 1003 W Main Cross St
- 925 W Main Cross St
- 1009 W Main Cross St
- 921 W Main Cross St
- 316 Portz Ave
- 1015 W Main Cross St
- 320 Portz Ave
- 910 Adams St
- 932 W Main Cross St
- 922 W Main Cross St
- 326 Portz Ave
- 1021 W Main Cross St
- 918 W Main Cross St
- 915 W Main Cross St
- 914 Adams St
- 916 W Main Cross St
- 920 Adams St
- 1012 W Main Cross St
- 912 W Main Cross St