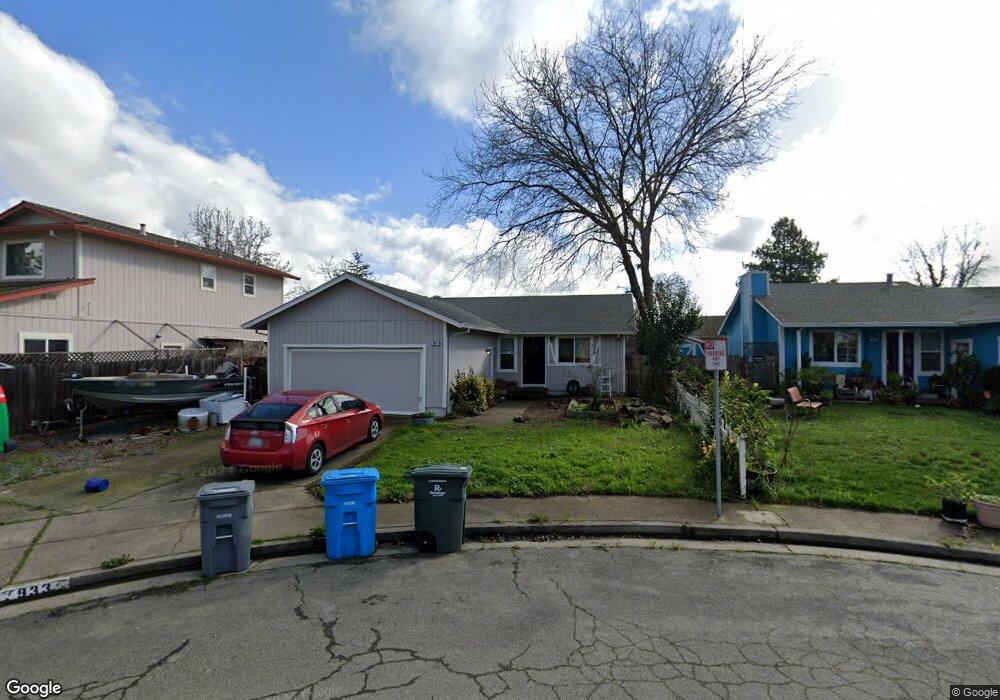
933 Wilkey Ct Santa Rosa, CA 95407
Wright Area Action Group NeighborhoodEstimated Value: $295,000 - $569,000
3
Beds
2
Baths
1,099
Sq Ft
$441/Sq Ft
Est. Value
About This Home
This home is located at 933 Wilkey Ct, Santa Rosa, CA 95407 and is currently estimated at $484,278, approximately $440 per square foot. 933 Wilkey Ct is a home located in Sonoma County with nearby schools including Robert L. Stevens Elementary, Elsie Allen High School, and St. Michael's Orthodox School.
Ownership History
Date
Name
Owned For
Owner Type
Purchase Details
Closed on
Sep 21, 2004
Sold by
Powers Helen
Bought by
Powers Helen and Helen Powers Revocable Trust
Current Estimated Value
Purchase Details
Closed on
Aug 3, 1995
Sold by
Kidd William and Kidd Theresa
Bought by
Powers Paul P and Powers Helen
Create a Home Valuation Report for This Property
The Home Valuation Report is an in-depth analysis detailing your home's value as well as a comparison with similar homes in the area
Home Values in the Area
Average Home Value in this Area
Purchase History
| Date | Buyer | Sale Price | Title Company |
|---|---|---|---|
| Powers Helen | -- | -- | |
| Powers Paul P | $57,000 | -- |
Source: Public Records
Tax History Compared to Growth
Tax History
| Year | Tax Paid | Tax Assessment Tax Assessment Total Assessment is a certain percentage of the fair market value that is determined by local assessors to be the total taxable value of land and additions on the property. | Land | Improvement |
|---|---|---|---|---|
| 2025 | $2,377 | $207,588 | $89,607 | $117,981 |
| 2024 | $2,377 | $203,518 | $87,850 | $115,668 |
| 2023 | $2,377 | $199,528 | $86,128 | $113,400 |
| 2022 | $2,244 | $195,617 | $84,440 | $111,177 |
| 2021 | $2,204 | $191,783 | $82,785 | $108,998 |
| 2020 | $2,195 | $189,818 | $81,937 | $107,881 |
| 2019 | $2,176 | $186,097 | $80,331 | $105,766 |
| 2018 | $2,160 | $182,449 | $78,756 | $103,693 |
| 2017 | $2,116 | $178,872 | $77,212 | $101,660 |
| 2016 | $2,091 | $175,366 | $75,699 | $99,667 |
| 2015 | $2,024 | $172,732 | $74,562 | $98,170 |
| 2014 | $1,949 | $169,349 | $73,102 | $96,247 |
Source: Public Records
Map
Nearby Homes
- 628 Wisteria Ln
- 534 E Jasmine Cir
- 576 E Jasmine Cir
- 2006 Lazzini Ave
- 751 W Jasmine Cir Unit 3
- 2002 Marble St
- 666 Brittain Ln
- 1521 Hughes Ave
- 48 Leisure Park Cir
- 1101 Burbank Ave
- 94 Leisure Park Cir
- Plan 4 at Brittain Oaks
- Plan 3 at Brittain Oaks
- Plan 2 at Brittain Oaks
- Plan 1 at Brittain Oaks
- 59 Roundelay Ln
- 2488 Giffen Ave
- 374 Gate Way
- 62 Romani Ct
- 70 Romani Ct