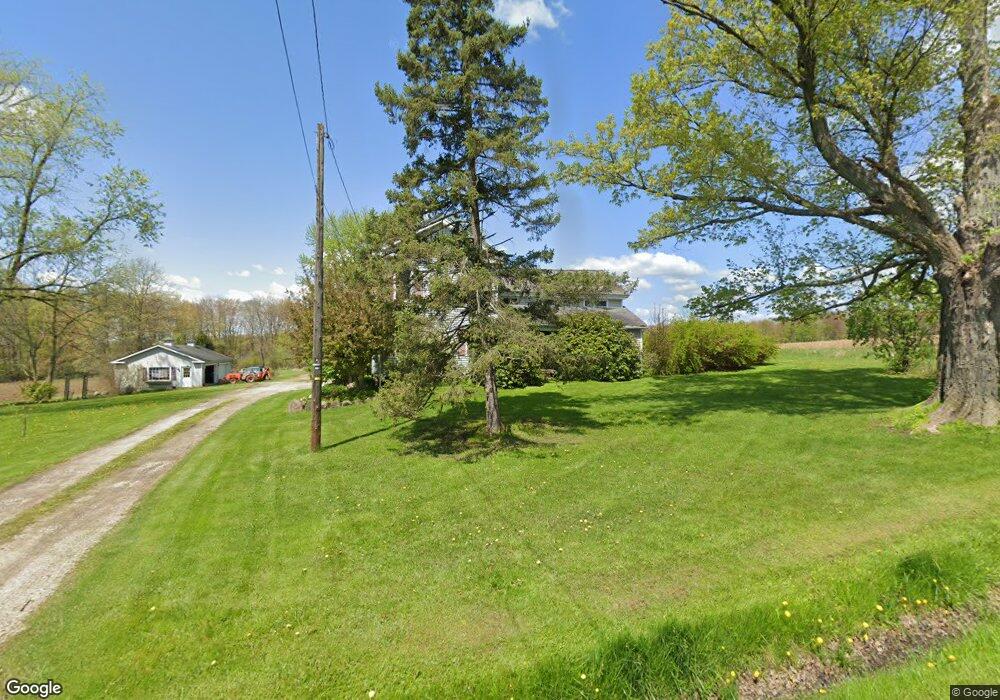
9335 Limeridge Rd Mantua, OH 44255
Estimated Value: $191,000 - $339,000
4
Beds
1
Bath
1,955
Sq Ft
$145/Sq Ft
Est. Value
About This Home
This home is located at 9335 Limeridge Rd, Mantua, OH 44255 and is currently estimated at $284,303, approximately $145 per square foot. 9335 Limeridge Rd is a home located in Portage County with nearby schools including James A. Garfield Elementary School, James A. Garfield Middle School, and James A. Garfield High School.
Ownership History
Date
Name
Owned For
Owner Type
Purchase Details
Closed on
Apr 9, 2012
Sold by
Kane Melissa S
Bought by
Kane Melissa S and Tresler Gerald L
Current Estimated Value
Home Financials for this Owner
Home Financials are based on the most recent Mortgage that was taken out on this home.
Original Mortgage
$40,000
Outstanding Balance
$27,430
Interest Rate
3.91%
Mortgage Type
New Conventional
Estimated Equity
$256,873
Purchase Details
Closed on
Feb 15, 2012
Sold by
Tresler Gerald L
Bought by
Kane Melissa S
Home Financials for this Owner
Home Financials are based on the most recent Mortgage that was taken out on this home.
Original Mortgage
$40,000
Outstanding Balance
$27,430
Interest Rate
3.91%
Mortgage Type
New Conventional
Estimated Equity
$256,873
Purchase Details
Closed on
Sep 17, 1997
Sold by
Tresler Nancy L
Bought by
Tresler Gerald L
Home Financials for this Owner
Home Financials are based on the most recent Mortgage that was taken out on this home.
Original Mortgage
$92,400
Interest Rate
11.8%
Mortgage Type
New Conventional
Create a Home Valuation Report for This Property
The Home Valuation Report is an in-depth analysis detailing your home's value as well as a comparison with similar homes in the area
Home Values in the Area
Average Home Value in this Area
Purchase History
| Date | Buyer | Sale Price | Title Company |
|---|---|---|---|
| Kane Melissa S | -- | Patriot Title Agency | |
| Kane Melissa S | $84,000 | Patriot Title Agency Inc | |
| Tresler Gerald L | $13,500 | -- |
Source: Public Records
Mortgage History
| Date | Status | Borrower | Loan Amount |
|---|---|---|---|
| Open | Kane Melissa S | $40,000 | |
| Previous Owner | Tresler Gerald L | $92,400 |
Source: Public Records
Tax History Compared to Growth
Tax History
| Year | Tax Paid | Tax Assessment Tax Assessment Total Assessment is a certain percentage of the fair market value that is determined by local assessors to be the total taxable value of land and additions on the property. | Land | Improvement |
|---|---|---|---|---|
| 2024 | $2,644 | $87,680 | $17,610 | $70,070 |
| 2023 | $2,278 | $68,400 | $14,040 | $54,360 |
| 2022 | $2,297 | $68,400 | $14,040 | $54,360 |
| 2021 | $2,219 | $68,400 | $14,040 | $54,360 |
| 2020 | $1,908 | $59,050 | $13,370 | $45,680 |
| 2019 | $1,913 | $59,050 | $13,370 | $45,680 |
| 2018 | $2,337 | $52,960 | $13,370 | $39,590 |
| 2017 | $2,337 | $52,960 | $13,370 | $39,590 |
| 2016 | $2,259 | $52,960 | $13,370 | $39,590 |
| 2015 | $2,272 | $52,960 | $13,370 | $39,590 |
| 2014 | $2,310 | $52,960 | $13,370 | $39,590 |
| 2013 | $2,289 | $52,960 | $13,370 | $39,590 |
Source: Public Records
Map
Nearby Homes
- 5961 Streeter Rd
- 5248 State Route 303
- 6229 Streeter Rd
- 10039 Ohio 700
- 9091 State Route 44
- 8121 Cooley Rd
- 5372 Mennonite Rd
- 9941 Nichols Rd
- 6994 Hankee Rd
- 7076 Hankee Rd
- 4278 Dudley Rd
- 7688 Ohio 88
- 10787 Park St
- 4596 W Prospect St
- 9310 Slagle Rd
- 0 Ambler Ln Unit 5142203
- 7686 Peck Rd
- 0 Slagle Unit 5156249
- 4196 Webb Rd
- 6404 Pioneer Trail
- 9324 Limeridge Rd
- 9338 Limeridge Rd
- 9418 Limeridge Rd
- 9214 Limeridge Rd
- 9200 Limeridge Rd
- 9508 Limeridge Rd
- V/L Limeridge Rd
- 9148 Limeridge Rd
- 9445 Limeridge Rd
- 9595 Limeridge Rd
- 5835 State Route 303
- 5923 State Route 303
- 5907 State Route 303
- 5907 State Route 303
- 5891 State Route 303
- 5868 State Route 303
- V/L Limeridge Rd
- 5794 State Route 303
- 5923 Ohio 303
- 5896 State Route 303