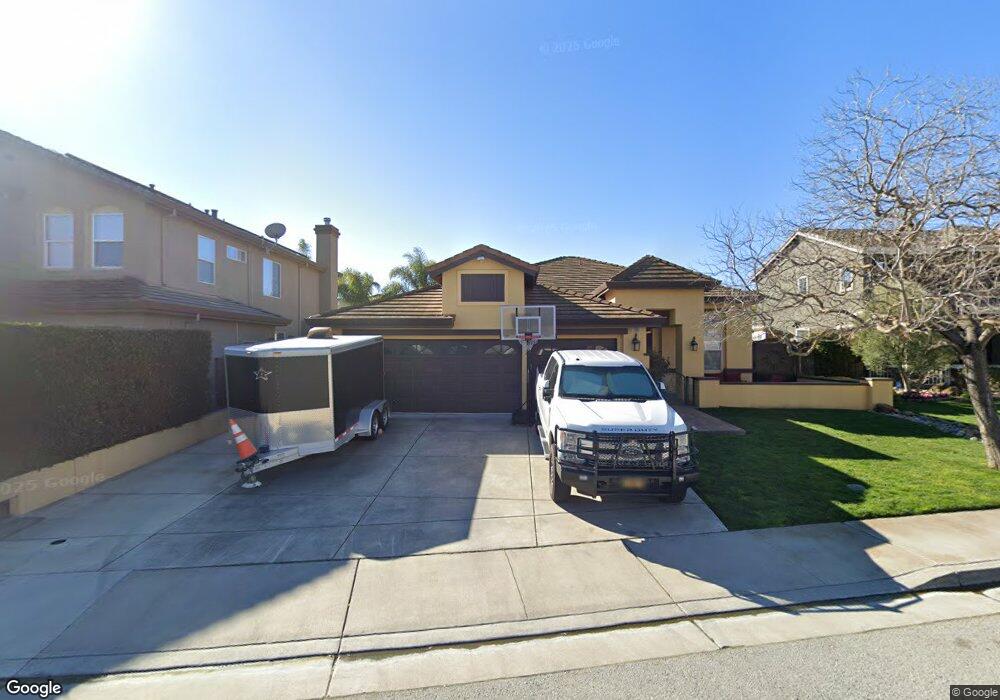
934 Ferragalli Ct Gilroy, CA 95020
Las Animas NeighborhoodEstimated Value: $1,050,545 - $1,192,000
4
Beds
2
Baths
1,927
Sq Ft
$565/Sq Ft
Est. Value
About This Home
This home is located at 934 Ferragalli Ct, Gilroy, CA 95020 and is currently estimated at $1,089,386, approximately $565 per square foot. 934 Ferragalli Ct is a home located in Santa Clara County with nearby schools including Solorsano Middle School, South Valley Middle School, and Christopher High School.
Ownership History
Date
Name
Owned For
Owner Type
Purchase Details
Closed on
Dec 13, 2006
Sold by
Valentine Michael G and Choe Susan S
Bought by
Valentine Michael G and Choe Valentine Susan S
Current Estimated Value
Purchase Details
Closed on
Feb 1, 2005
Sold by
Reynolds Chris
Bought by
Valentine Michael G and Choe Susan S
Home Financials for this Owner
Home Financials are based on the most recent Mortgage that was taken out on this home.
Original Mortgage
$540,000
Outstanding Balance
$274,293
Interest Rate
5.74%
Mortgage Type
Purchase Money Mortgage
Estimated Equity
$815,093
Purchase Details
Closed on
Sep 5, 2001
Sold by
Reynolds Chris and Reynolds Joy L
Bought by
Reynolds Chris
Home Financials for this Owner
Home Financials are based on the most recent Mortgage that was taken out on this home.
Original Mortgage
$387,800
Interest Rate
7%
Purchase Details
Closed on
Aug 3, 2000
Sold by
The Old Orchard Company
Bought by
Reynolds Chris and Reynolds Joy L
Home Financials for this Owner
Home Financials are based on the most recent Mortgage that was taken out on this home.
Original Mortgage
$369,337
Interest Rate
8.89%
Create a Home Valuation Report for This Property
The Home Valuation Report is an in-depth analysis detailing your home's value as well as a comparison with similar homes in the area
Home Values in the Area
Average Home Value in this Area
Purchase History
| Date | Buyer | Sale Price | Title Company |
|---|---|---|---|
| Valentine Michael G | -- | None Available | |
| Valentine Michael G | $675,000 | New Century Title Company | |
| Reynolds Chris | -- | Old Republic Title Company | |
| Reynolds Chris | $411,000 | Old Republic Title Company |
Source: Public Records
Mortgage History
| Date | Status | Borrower | Loan Amount |
|---|---|---|---|
| Open | Valentine Michael G | $540,000 | |
| Previous Owner | Reynolds Chris | $387,800 | |
| Previous Owner | Reynolds Chris | $369,337 |
Source: Public Records
Tax History
| Year | Tax Paid | Tax Assessment Tax Assessment Total Assessment is a certain percentage of the fair market value that is determined by local assessors to be the total taxable value of land and additions on the property. | Land | Improvement |
|---|---|---|---|---|
| 2025 | $11,420 | $940,526 | $376,209 | $564,317 |
| 2024 | $11,420 | $922,085 | $368,833 | $553,252 |
| 2023 | $11,354 | $904,005 | $361,601 | $542,404 |
| 2022 | $11,169 | $886,280 | $354,511 | $531,769 |
| 2021 | $11,121 | $868,903 | $347,560 | $521,343 |
| 2020 | $10,153 | $793,000 | $317,100 | $475,900 |
| 2019 | $9,772 | $762,000 | $304,700 | $457,300 |
| 2018 | $8,890 | $728,000 | $291,100 | $436,900 |
| 2017 | $8,751 | $688,000 | $275,100 | $412,900 |
| 2016 | $8,520 | $670,000 | $315,000 | $355,000 |
| 2015 | $7,890 | $647,900 | $259,200 | $388,700 |
| 2014 | $7,763 | $629,000 | $251,600 | $377,400 |
Source: Public Records
Map
Nearby Homes
- 946 Martiri Ct
- 1165 Lerma Ln
- 9400 Benbow Dr
- 1206 Sycamore Ct
- 9632 Cherrywood Ct
- 803 Sunrise Dr
- 1080 Sunrise Dr
- 9465 Eagle View Way
- 1501 Welburn Ave
- 1008 Primrose Ln
- 9130 Rancho Hills Dr
- 8980 Acorn Way
- 8940 Acorn Way
- 8170 Westwood Dr Unit 22
- 119 Farrell Ave
- 103 Farrell Ave
- 111 Farrell Ave
- 1610 Calabrese Way
- 8120 Catalina Ct
- 1750 Vista Del Sur
- 944 Ferragalli Ct
- 924 Ferragalli Ct
- 933 Moro Ct
- 923 Moro Ct
- 954 Ferragalli Ct
- 914 Ferragalli Ct
- 943 Moro Ct
- 913 Moro Ct
- 945 Ferragalli Ct
- 955 Ferragalli Ct
- 953 Moro Ct
- 935 Ferragalli Ct
- 964 Ferragalli Ct
- 925 Ferragalli Ct
- 904 Ferragalli Ct
- 965 Ferragalli Ct
- 903 Moro Ct
- 963 Moro Ct
- 915 Ferragalli Ct
- 975 Ferragalli Ct
Your Personal Tour Guide
Ask me questions while you tour the home.