934 Garnet Ave Unit 15 Lehigh Acres, FL 33974
Eisenhower NeighborhoodEstimated Value: $313,156 - $328,000
4
Beds
2
Baths
1,869
Sq Ft
$171/Sq Ft
Est. Value
About This Home
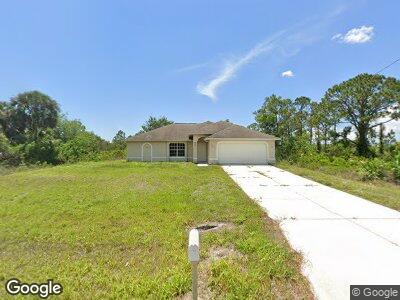
This home is located at 934 Garnet Ave Unit 15, Lehigh Acres, FL 33974 and is currently estimated at $319,789, approximately $171 per square foot. 934 Garnet Ave Unit 15 is a home located in Lee County with nearby schools including Lehigh Elementary School, Gateway Elementary School, and The Alva School.
Ownership History
Date
Name
Owned For
Owner Type
Purchase Details
Closed on
Jul 12, 2016
Sold by
Rlhak Llc
Bought by
Tang Zong Xing and Zhang Cindy
Current Estimated Value
Purchase Details
Closed on
Sep 22, 2009
Sold by
Midcountry Bank
Bought by
Rlhak Llc
Purchase Details
Closed on
Jul 6, 2009
Sold by
Ostrander Kimberly
Bought by
Midcountry Bank
Purchase Details
Closed on
Nov 18, 2005
Sold by
Fuller Sophia B
Bought by
Ostrander Kimberly
Home Financials for this Owner
Home Financials are based on the most recent Mortgage that was taken out on this home.
Original Mortgage
$237,600
Interest Rate
6.23%
Mortgage Type
Construction
Purchase Details
Closed on
May 30, 2003
Sold by
Davis Martha Ann and Davis Bernard P
Bought by
Palmer & Palmer Real Est Inc
Purchase Details
Closed on
Dec 8, 1998
Sold by
Velpen Clement Vander and Duerinckx Lisette
Bought by
Crapper Paul H
Create a Home Valuation Report for This Property
The Home Valuation Report is an in-depth analysis detailing your home's value as well as a comparison with similar homes in the area
Home Values in the Area
Average Home Value in this Area
Purchase History
| Date | Buyer | Sale Price | Title Company |
|---|---|---|---|
| Tang Zong Xing | $120,000 | Aaccurate Title Services Of | |
| Rlhak Llc | $57,900 | Title Professionals Of Flori | |
| Midcountry Bank | -- | Attorney | |
| Ostrander Kimberly | $49,000 | Towns Title & Co Inc | |
| Palmer & Palmer Real Est Inc | $2,000 | -- | |
| Crapper Paul H | $300 | -- |
Source: Public Records
Mortgage History
| Date | Status | Borrower | Loan Amount |
|---|---|---|---|
| Previous Owner | Ostrander Kimberly | $237,600 |
Source: Public Records
Tax History Compared to Growth
Tax History
| Year | Tax Paid | Tax Assessment Tax Assessment Total Assessment is a certain percentage of the fair market value that is determined by local assessors to be the total taxable value of land and additions on the property. | Land | Improvement |
|---|---|---|---|---|
| 2024 | $3,032 | $212,307 | -- | -- |
| 2023 | $3,418 | $193,006 | $0 | $0 |
| 2022 | $3,032 | $175,460 | $0 | $0 |
| 2021 | $2,578 | $159,509 | $4,250 | $155,259 |
| 2020 | $2,497 | $149,383 | $3,750 | $145,633 |
| 2019 | $2,441 | $142,930 | $3,700 | $139,230 |
| 2018 | $2,264 | $126,787 | $3,700 | $123,087 |
| 2017 | $2,264 | $125,974 | $4,000 | $121,974 |
| 2016 | $1,819 | $100,456 | $4,000 | $96,456 |
| 2015 | $1,690 | $89,700 | $2,900 | $86,800 |
| 2014 | -- | $81,701 | $2,585 | $79,116 |
| 2013 | -- | $68,007 | $2,200 | $65,807 |
Source: Public Records
Map
Nearby Homes
- 934 Garnet Ave
- 941 Garnet Ave
- 911 Foxdale Ave
- 909 Foxdale Ave
- 939 Foxdale Ave
- 901 Foxdale Ave
- 917 Nimitz Blvd
- 1126 Nimitz Blvd
- 1147 Nimitz Blvd
- 1127 Nimitz Blvd
- 666 Nimitz Blvd
- 505 Nimitz Blvd
- 1036 Nimitz Blvd
- 927 Joponica Ave S
- 919 Nimitz Blvd
- 935 Elgin St
- 1004 Chadwick St
- 1030 Fayette Ave
- 849 Portland St E
- 947 Chadwick Ave
- 934 Garnet Ave Unit 15
- 914 Foxdale Ave
- 916 Foxdale Ave
- 935 Garnet Ave
- 939 Garnet Ave
- 925 Foxdale Ave
- 923 Foxdale Ave
- 927 Foxdale Ave
- 941 Garnet Ave Unit 5
- 940 Foxdale Ave
- 913 Foxdale Ave
- 941 Foxdale Ave Unit 42
- 919 Foxdale Ave
- 946 Foxdale Ave
- 944 Garnet Ave
- 948 Foxdale Ave
- 950 Foxdale Ave
- 946 Garnet Ave
- 945 Foxdale Ave
- 914 Danube St Unit 1