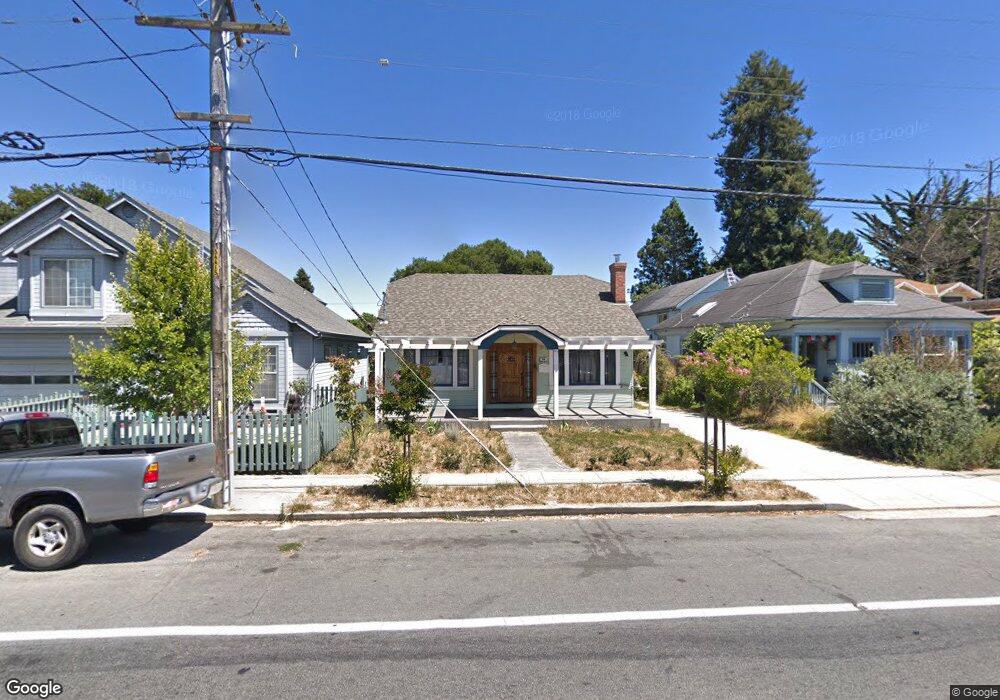
934 N Branciforte Ave Santa Cruz, CA 95062
Banana Belt NeighborhoodEstimated Value: $1,045,000 - $1,365,000
2
Beds
1
Bath
1,250
Sq Ft
$963/Sq Ft
Est. Value
About This Home
This home is located at 934 N Branciforte Ave, Santa Cruz, CA 95062 and is currently estimated at $1,203,667, approximately $962 per square foot. 934 N Branciforte Ave is a home located in Santa Cruz County with nearby schools including De Laveaga Elementary School, Mission Hill Middle School, and Harbor High School.
Ownership History
Date
Name
Owned For
Owner Type
Purchase Details
Closed on
Nov 22, 2021
Sold by
Susie Sha
Bought by
Susie Sha Trust
Current Estimated Value
Home Financials for this Owner
Home Financials are based on the most recent Mortgage that was taken out on this home.
Original Mortgage
$425,000
Interest Rate
3.56%
Mortgage Type
New Conventional
Purchase Details
Closed on
Dec 14, 2011
Sold by
U S Bank National Association
Bought by
Sha Susie and Susie Sha Trust
Purchase Details
Closed on
May 10, 2011
Sold by
Harrigan Denise and Harrigan Paul
Bought by
Us Bank National Association
Purchase Details
Closed on
Oct 22, 1993
Sold by
James Evelina and James Benjamin F
Bought by
Harrigan Paul and Harrigan Denise
Create a Home Valuation Report for This Property
The Home Valuation Report is an in-depth analysis detailing your home's value as well as a comparison with similar homes in the area
Home Values in the Area
Average Home Value in this Area
Purchase History
| Date | Buyer | Sale Price | Title Company |
|---|---|---|---|
| Susie Sha Trust | -- | Accommodation/Courtesy Recordi | |
| Sha Susie | -- | Fidelity National Title | |
| Sha Susie | $319,000 | First American Title Company | |
| Us Bank National Association | $340,994 | None Available | |
| Harrigan Paul | $130,000 | -- |
Source: Public Records
Mortgage History
| Date | Status | Borrower | Loan Amount |
|---|---|---|---|
| Previous Owner | Sha Susie | $425,000 |
Source: Public Records
Tax History Compared to Growth
Tax History
| Year | Tax Paid | Tax Assessment Tax Assessment Total Assessment is a certain percentage of the fair market value that is determined by local assessors to be the total taxable value of land and additions on the property. | Land | Improvement |
|---|---|---|---|---|
| 2025 | $6,725 | $596,688 | $256,328 | $340,360 |
| 2023 | $6,643 | $573,517 | $246,374 | $327,143 |
| 2022 | $5,597 | $474,272 | $226,543 | $247,729 |
| 2021 | $4,819 | $405,068 | $222,101 | $182,967 |
| 2020 | $4,404 | $366,373 | $219,824 | $146,549 |
| 2019 | $4,301 | $359,190 | $215,514 | $143,676 |
| 2018 | $4,253 | $352,147 | $211,288 | $140,859 |
| 2017 | $4,200 | $345,241 | $207,144 | $138,097 |
| 2016 | $3,978 | $338,471 | $203,082 | $135,389 |
| 2015 | $3,823 | $333,387 | $200,032 | $133,355 |
| 2014 | $3,760 | $326,857 | $196,114 | $130,743 |
Source: Public Records
Map
Nearby Homes
- 0 Market St
- 719 Darwin St
- 118 Stoney Creek Rd
- 305 Morrissey Blvd
- 229 Coulson Ave
- 209 Fieldcrest Ln
- 104 Meadowview Ln
- 1221 Broadway Unit 2
- 111 Elk St
- 916 Melrose Ave
- 511 Pacheco Ave
- 33 Edgewood Way
- 180 Delaveaga Park Dr
- 180 Dakota Ave Unit D
- 1122 Seabright Ave
- 205 Roosevelt Terrace
- 1720 Ocean St
- 130 Darwin St
- 315 Ocean St
- 2030 N Pacific Ave Unit 314
- 930 N Branciforte Ave
- 938 N Branciforte Ave
- 926 N Branciforte Ave
- 942 N Branciforte Ave
- 131 Stanford Ave
- 123 Stanford Ave
- 127 Stanford Ave
- 203 Stanford Ave
- 121 Stanford Ave
- 922 N Branciforte Ave
- 946 N Branciforte Ave
- 207 Stanford Ave
- 933 N Branciforte Ave
- 950 N Branciforte Ave
- 918 N Branciforte Ave
- 939 N Branciforte Ave
- 943 N Branciforte Ave
- 211 Stanford Ave
- 945 N Branciforte Ave
- 1002 N Branciforte Ave