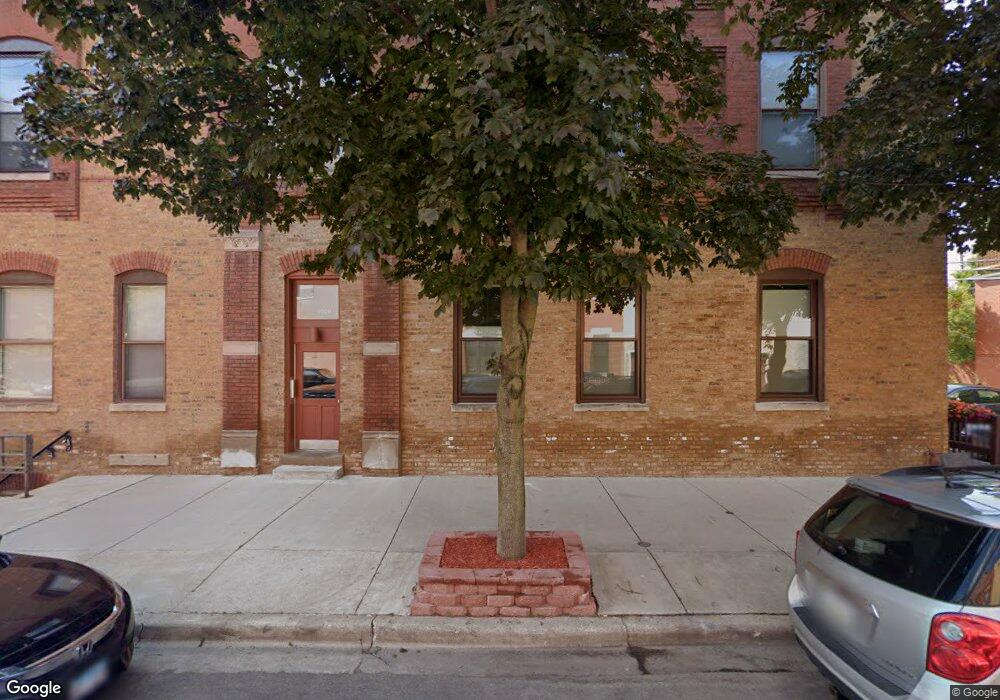
934 W Willow St Unit 9343 Chicago, IL 60614
Old Town NeighborhoodEstimated Value: $324,000 - $371,217
2
Beds
1
Bath
15,960
Sq Ft
$22/Sq Ft
Est. Value
About This Home
This home is located at 934 W Willow St Unit 9343, Chicago, IL 60614 and is currently estimated at $348,554, approximately $21 per square foot. 934 W Willow St Unit 9343 is a home located in Cook County with nearby schools including Mayer Elementary School, Lincoln Park High School, and The Noble Academy.
Ownership History
Date
Name
Owned For
Owner Type
Purchase Details
Closed on
Aug 21, 2016
Sold by
Schaller Matthew V
Bought by
Schaller Matthew V and Schaller Honorine N
Current Estimated Value
Purchase Details
Closed on
May 14, 2012
Sold by
Tay Lance A
Bought by
Schaller Matthew V
Home Financials for this Owner
Home Financials are based on the most recent Mortgage that was taken out on this home.
Original Mortgage
$175,750
Outstanding Balance
$120,291
Interest Rate
3.87%
Mortgage Type
New Conventional
Estimated Equity
$228,263
Purchase Details
Closed on
May 30, 1995
Sold by
Federal Home Mtg Corp
Bought by
Tay Lance A
Home Financials for this Owner
Home Financials are based on the most recent Mortgage that was taken out on this home.
Original Mortgage
$115,200
Interest Rate
7.9%
Purchase Details
Closed on
Feb 7, 1995
Sold by
Sheahan Michael F
Bought by
Federal Home Loan Mortgage Corporation
Create a Home Valuation Report for This Property
The Home Valuation Report is an in-depth analysis detailing your home's value as well as a comparison with similar homes in the area
Home Values in the Area
Average Home Value in this Area
Purchase History
| Date | Buyer | Sale Price | Title Company |
|---|---|---|---|
| Schaller Matthew V | -- | None Available | |
| Schaller Matthew V | $185,000 | Gmt | |
| Tay Lance A | $192,000 | First American Title | |
| Federal Home Loan Mortgage Corporation | -- | -- |
Source: Public Records
Mortgage History
| Date | Status | Borrower | Loan Amount |
|---|---|---|---|
| Open | Schaller Matthew V | $175,750 | |
| Previous Owner | Tay Lance A | $115,200 |
Source: Public Records
Tax History
| Year | Tax Paid | Tax Assessment Tax Assessment Total Assessment is a certain percentage of the fair market value that is determined by local assessors to be the total taxable value of land and additions on the property. | Land | Improvement |
|---|---|---|---|---|
| 2025 | $5,208 | $31,988 | $7,552 | $24,436 |
| 2024 | $5,208 | $31,988 | $7,552 | $24,436 |
| 2023 | $5,055 | $28,000 | $7,320 | $20,680 |
| 2022 | $5,055 | $28,000 | $7,320 | $20,680 |
| 2021 | $4,961 | $27,999 | $7,319 | $20,680 |
| 2020 | $4,895 | $25,077 | $5,359 | $19,718 |
| 2019 | $4,783 | $27,237 | $5,359 | $21,878 |
| 2018 | $4,702 | $27,237 | $5,359 | $21,878 |
| 2017 | $3,779 | $20,928 | $4,384 | $16,544 |
| 2016 | $3,691 | $20,928 | $4,384 | $16,544 |
| 2015 | $3,354 | $20,928 | $4,384 | $16,544 |
| 2014 | $2,492 | $15,999 | $3,288 | $12,711 |
| 2013 | $2,910 | $15,999 | $3,288 | $12,711 |
Source: Public Records
Map
Nearby Homes
- 1823 N Bissell St
- 1837 N Fremont St
- 1826 N Dayton St
- 1873 N Bissell St
- 1725 N Sheffield Ave Unit 1
- 1919 N Sheffield Ave Unit 2
- 1934 N Bissell St
- 1931 N Sheffield Ave
- 1851 N Halsted St Unit 2
- 1845 N Halsted St Unit B
- 1921 N Dayton St
- 1651 N Dayton St Unit 203
- 1910 N Halsted St Unit 1S
- 1719 N Halsted St Unit B
- 1926 N Halsted St
- 1627 N Dayton St
- 1962 N Bissell St
- 1865 N Burling St
- 1920 N Maud Ave Unit D
- 1631 N Halsted St
- 936 W Willow St Unit 9361
- 936 W Willow St Unit 9363
- 936 W Willow St Unit 9362
- 932 W Willow St Unit 1
- 936 W Willow St Unit 1
- 934 W Willow St Unit 9342
- 934 W Willow St Unit 18083B
- 934 W Willow St Unit 3
- 934 W Willow St Unit 2
- 938 W Willow St
- 938 W Willow St Unit 1
- 938 W Willow St Unit 2
- 1801 N Bissell St
- 1801 N Bissell St Unit 1R
- 1801 N Bissell St Unit 3R
- 924 W Willow St
- 1816 N Bissell St Unit 1816
- 1812 N Bissell St Unit 1812
- 1814 N Bissell St Unit 1814
- 922 W Willow St
Your Personal Tour Guide
Ask me questions while you tour the home.