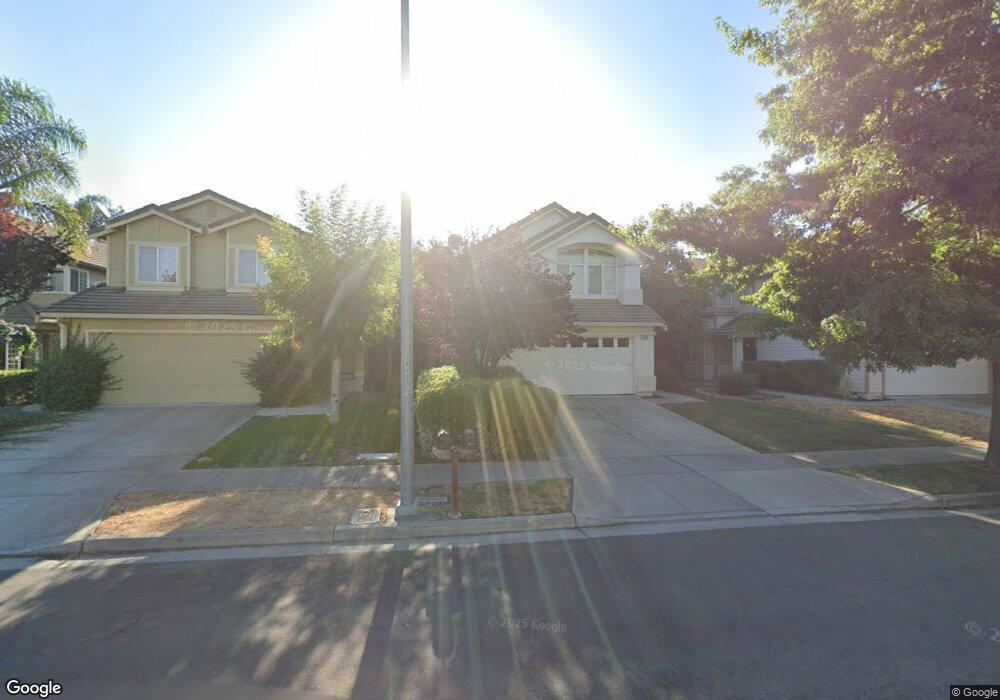
9340 Benbow Dr Gilroy, CA 95020
Las Animas NeighborhoodEstimated Value: $826,000 - $993,000
About This Home
This home is located at 9340 Benbow Dr, Gilroy, CA 95020 and is currently estimated at $930,799, approximately $666 per square foot. 9340 Benbow Dr is a home located in Santa Clara County with nearby schools including Luigi Aprea Elementary School, Brownell Middle School, and Solorsano Middle School.
Ownership History
We collect this data history from publicly available records. To have your information removed, we recommend requesting removal directly through your county’s website.
Purchase Details
Purchase Details
Home Financials for this Owner
Home Financials are based on the most recent Mortgage that was taken out on this home.Purchase Details
Home Financials for this Owner
Home Financials are based on the most recent Mortgage that was taken out on this home.Home Values in the Area
Average Home Value in this Area
Purchase History
We collect this data history from publicly available records. To have your information removed, we recommend requesting removal directly through your county’s website.
| Date | Buyer | Sale Price | Title Company |
|---|---|---|---|
| -- | Old Republic Title Company | ||
| $390,000 | Fidelity National Title Co | ||
| -- | Golden California Title Co | ||
| $225,500 | Golden California Title Co |
Mortgage History
We collect this data history from publicly available records. To have your information removed, we recommend requesting removal directly through your county’s website.
| Date | Status | Borrower | Loan Amount |
|---|---|---|---|
| Open | $311,950 | ||
| Previous Owner | $180,300 | ||
| Closed | $78,000 |
Tax History
We collect this data history from publicly available records. To have your information removed, we recommend requesting removal directly through your county’s website.
| Year | Tax Paid | Tax Assessment Tax Assessment Total Assessment is a certain percentage of the fair market value that is determined by local assessors to be the total taxable value of land and additions on the property. | Land | Improvement |
|---|---|---|---|---|
| 2025 | $7,049 | $576,125 | $230,446 | $345,679 |
| 2024 | $7,049 | $564,829 | $225,928 | $338,901 |
| 2023 | $7,008 | $553,755 | $221,499 | $332,256 |
| 2022 | $6,893 | $542,898 | $217,156 | $325,742 |
| 2021 | $6,862 | $532,254 | $212,899 | $319,355 |
| 2020 | $6,787 | $526,797 | $210,716 | $316,081 |
| 2019 | $6,725 | $516,469 | $206,585 | $309,884 |
| 2018 | $6,280 | $506,343 | $202,535 | $303,808 |
| 2017 | $6,412 | $496,415 | $198,564 | $297,851 |
| 2016 | $6,282 | $486,682 | $194,671 | $292,011 |
| 2015 | $5,928 | $479,372 | $191,747 | $287,625 |
| 2014 | $5,891 | $469,982 | $187,991 | $281,991 |
Map
- 9402 Rodeo Dr
- 887 Martiri Dr
- 9272 El Caminito
- 9555 Santa Teresa Blvd
- 9632 Cherrywood Ct
- 9290 Briarberry Ln
- 1080 Sunrise Dr
- 1201 Blue Parrot Ct
- 9110 Avezan Way
- 8881 Zinnia St
- 9610 Eagle View Way
- 735 Painter Ct
- 1301 Peregrine Dr
- 1206 Sycamore Ct
- 807 Ramona Way
- 1494 Partridge Dr
- 936 Jaguar Place
- 8545 Ousley Dr
- 8940 Acorn Way
- 500 Ronan Ave
- 9350 Benbow Dr
- 9330 Benbow Dr
- 9320 Benbow Dr
- 9370 Benbow Dr
- 9310 Benbow Dr
- 9380 Benbow Dr
- 9343 Benbow Dr
- 9333 Benbow Dr
- 9300 Benbow Dr
- 9353 Benbow Dr
- 995 Sage Hill Dr
- 9363 Benbow Dr
- 9390 Benbow Dr
- 9373 Benbow Dr
- 1005 Sage Hill Dr
- 985 Summerhill Cir
- 980 Sage Hill Dr
- 991 Woodcreek Way
- 9383 Benbow Dr
- 1025 Sage Hill Dr
Ask me questions while you tour the home.