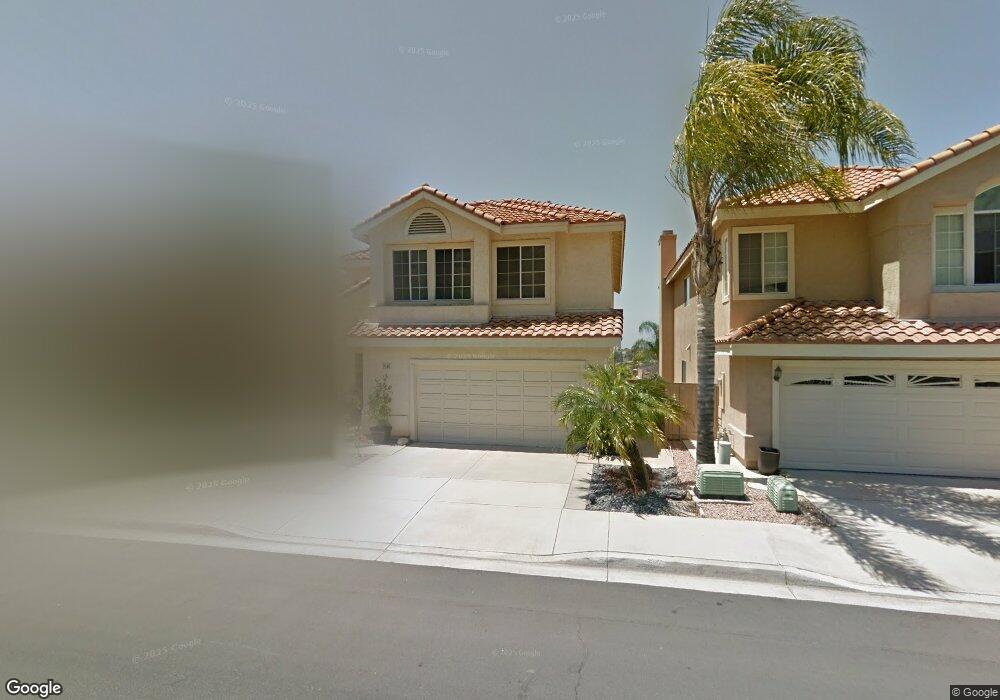
9340 Chabola Rd San Diego, CA 92129
Mira Mesa NeighborhoodEstimated Value: $1,468,540 - $1,559,000
4
Beds
3
Baths
2,356
Sq Ft
$649/Sq Ft
Est. Value
About This Home
This home is located at 9340 Chabola Rd, San Diego, CA 92129 and is currently estimated at $1,529,885, approximately $649 per square foot. 9340 Chabola Rd is a home located in San Diego County with nearby schools including Hage Elementary School, Wangenheim Middle School, and Mira Mesa High School.
Ownership History
Date
Name
Owned For
Owner Type
Purchase Details
Closed on
Feb 19, 2003
Sold by
Romen Romel T and Romen Maria Elisa Resurreccion
Bought by
Romen Romel T and Romen Maria Elisa Resurreccion
Current Estimated Value
Home Financials for this Owner
Home Financials are based on the most recent Mortgage that was taken out on this home.
Original Mortgage
$256,000
Outstanding Balance
$109,478
Interest Rate
5.93%
Estimated Equity
$1,420,407
Purchase Details
Closed on
May 9, 2000
Sold by
Romen Romel T and Romen Maria E
Bought by
Romen Romel T and Romen Maria Elisa Resurreccion
Purchase Details
Closed on
Nov 27, 1991
Create a Home Valuation Report for This Property
The Home Valuation Report is an in-depth analysis detailing your home's value as well as a comparison with similar homes in the area
Home Values in the Area
Average Home Value in this Area
Purchase History
| Date | Buyer | Sale Price | Title Company |
|---|---|---|---|
| Romen Romel T | -- | Southland Title | |
| Romen Romel T | -- | Southland Title | |
| Romen Romel T | -- | -- | |
| -- | $296,200 | -- |
Source: Public Records
Mortgage History
| Date | Status | Borrower | Loan Amount |
|---|---|---|---|
| Open | Romen Romel T | $256,000 |
Source: Public Records
Tax History Compared to Growth
Tax History
| Year | Tax Paid | Tax Assessment Tax Assessment Total Assessment is a certain percentage of the fair market value that is determined by local assessors to be the total taxable value of land and additions on the property. | Land | Improvement |
|---|---|---|---|---|
| 2025 | $6,573 | $523,762 | $176,823 | $346,939 |
| 2024 | $6,573 | $513,493 | $173,356 | $340,137 |
| 2023 | $6,427 | $503,425 | $169,957 | $333,468 |
| 2022 | $6,269 | $493,555 | $166,625 | $326,930 |
| 2021 | $6,220 | $483,878 | $163,358 | $320,520 |
| 2020 | $6,134 | $478,917 | $161,683 | $317,234 |
| 2019 | $5,986 | $469,527 | $158,513 | $311,014 |
| 2018 | $5,573 | $460,321 | $155,405 | $304,916 |
| 2017 | $82 | $451,296 | $152,358 | $298,938 |
| 2016 | $5,349 | $442,448 | $149,371 | $293,077 |
| 2015 | $5,270 | $435,803 | $147,128 | $288,675 |
| 2014 | $5,188 | $427,267 | $144,246 | $283,021 |
Source: Public Records
Map
Nearby Homes
- 9378 Chabola Rd
- 9432 Hito Ct
- 9368 Babauta Rd Unit 95
- 9368 Babauta Rd Unit 93
- 11940 Black Mountain Rd Unit 41
- 11799 Westview Pkwy
- 9457 Questa Pointe Unit 21
- 9819 Kika Ct
- 11394 Pegasus Ave
- 9562 Benavente St
- 8761 Menkar Rd
- 9068 Buckwheat St
- 11279 Pegasus Ave
- 9471 Compass Point Dr S
- 12776 Isocoma St Unit 4
- 11416 Osoyoos Place
- 11377 Volans St
- 12727 Calle de Las Rosas
- 11368 Squamish Rd
- 8667 Cetus Rd