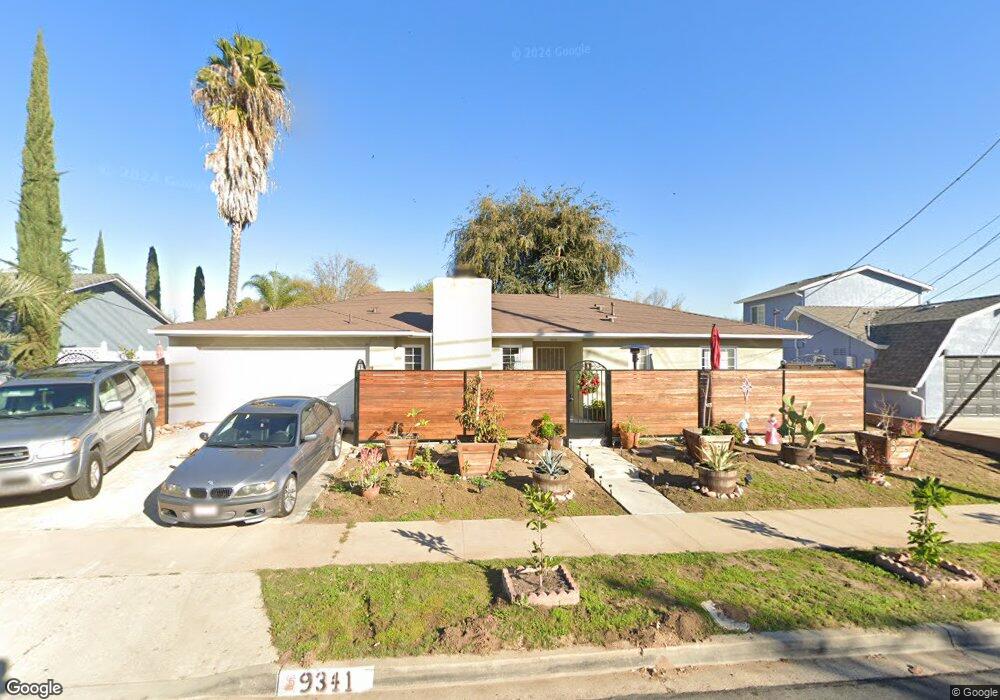
9341 Pebble Beach Dr Santee, CA 92071
East Elliott NeighborhoodEstimated Value: $768,000 - $857,000
3
Beds
2
Baths
1,340
Sq Ft
$612/Sq Ft
Est. Value
About This Home
This home is located at 9341 Pebble Beach Dr, Santee, CA 92071 and is currently estimated at $819,506, approximately $611 per square foot. 9341 Pebble Beach Dr is a home located in San Diego County with nearby schools including Carlton Oaks Elementary School and West Hills High School.
Ownership History
Date
Name
Owned For
Owner Type
Purchase Details
Closed on
Sep 12, 2000
Sold by
Morgan Torrence L and Morgan Kimberly D
Bought by
Soria David Anthony and Soria Telesfora Refugio
Current Estimated Value
Home Financials for this Owner
Home Financials are based on the most recent Mortgage that was taken out on this home.
Original Mortgage
$220,978
Outstanding Balance
$79,739
Interest Rate
7.96%
Mortgage Type
FHA
Estimated Equity
$739,767
Purchase Details
Closed on
Oct 18, 1996
Sold by
Shigebumi Sato
Bought by
Morgan Torrence L and Morgan Kimberly D
Home Financials for this Owner
Home Financials are based on the most recent Mortgage that was taken out on this home.
Original Mortgage
$150,756
Interest Rate
7.91%
Mortgage Type
VA
Purchase Details
Closed on
Mar 29, 1990
Purchase Details
Closed on
Apr 22, 1988
Create a Home Valuation Report for This Property
The Home Valuation Report is an in-depth analysis detailing your home's value as well as a comparison with similar homes in the area
Home Values in the Area
Average Home Value in this Area
Purchase History
| Date | Buyer | Sale Price | Title Company |
|---|---|---|---|
| Soria David Anthony | $223,000 | Stewart Title | |
| Morgan Torrence L | $148,000 | Stewart Title Co | |
| -- | $153,000 | -- | |
| -- | $123,000 | -- |
Source: Public Records
Mortgage History
| Date | Status | Borrower | Loan Amount |
|---|---|---|---|
| Open | Soria David Anthony | $220,978 | |
| Previous Owner | Morgan Torrence L | $150,756 |
Source: Public Records
Tax History
| Year | Tax Paid | Tax Assessment Tax Assessment Total Assessment is a certain percentage of the fair market value that is determined by local assessors to be the total taxable value of land and additions on the property. | Land | Improvement |
|---|---|---|---|---|
| 2025 | $4,466 | $378,576 | $120,536 | $258,040 |
| 2024 | $4,466 | $371,154 | $118,173 | $252,981 |
| 2023 | $4,328 | $363,877 | $115,856 | $248,021 |
| 2022 | $4,294 | $356,743 | $113,585 | $243,158 |
| 2021 | $4,233 | $349,749 | $111,358 | $238,391 |
| 2020 | $4,180 | $346,164 | $110,217 | $235,947 |
| 2019 | $4,033 | $339,377 | $108,056 | $231,321 |
| 2018 | $3,949 | $332,724 | $105,938 | $226,786 |
| 2017 | $3,896 | $326,201 | $103,861 | $222,340 |
| 2016 | $3,777 | $319,806 | $101,825 | $217,981 |
| 2015 | $3,726 | $315,003 | $100,296 | $214,707 |
| 2014 | $3,650 | $308,834 | $98,332 | $210,502 |
Source: Public Records
Map
Nearby Homes
- 9209 Arnaz Way
- 9219 Inverness Rd
- 8514 Boulder Way
- 9139 Inverness Rd
- 9220 Mast Blvd Unit 27
- 9649 Derald Rd
- 9349 Nalini Ct
- 8612 Arminda Cir Unit 51
- 9410 Pike Rd
- 9409 Pike Rd
- 8605 Arminda Cir Unit 6
- 8772 Glen Vista Way
- 8612 Arlington Way
- 9656 Domer Rd
- 8672 Camden Dr
- 8633 Amherst St
- 8513 Marrokal Ln
- 8545 Mission Gorge Rd Unit 130
- 8545 Mission Gorge Rd Unit 135
- 8545 Mission Gorge Rd Unit 147
- 9349 Pebble Beach Dr
- 9333 Pebble Beach Dr
- 9357 Pebble Beach Dr
- 9325 Pebble Beach Dr
- 9340 Pebble Beach Dr
- 9348 Pebble Beach Dr
- 9332 Pebble Beach Dr
- 9407 Pebble Beach Dr
- 9317 Pebble Beach Dr
- 9324 Pebble Beach Dr
- 9347 Knollwood Way
- 9355 Knollwood Way
- 8842 Rumson Dr
- 9339 Knollwood Way
- 9413 Pebble Beach Dr
- 9316 Pebble Beach Dr
- 9331 Knollwood Way
- 8928 Carlton Oaks Dr
- 8906 Carlton Oaks Dr Unit 2
- 8906 Carlton Oaks Dr Unit 1
Your Personal Tour Guide
Ask me questions while you tour the home.