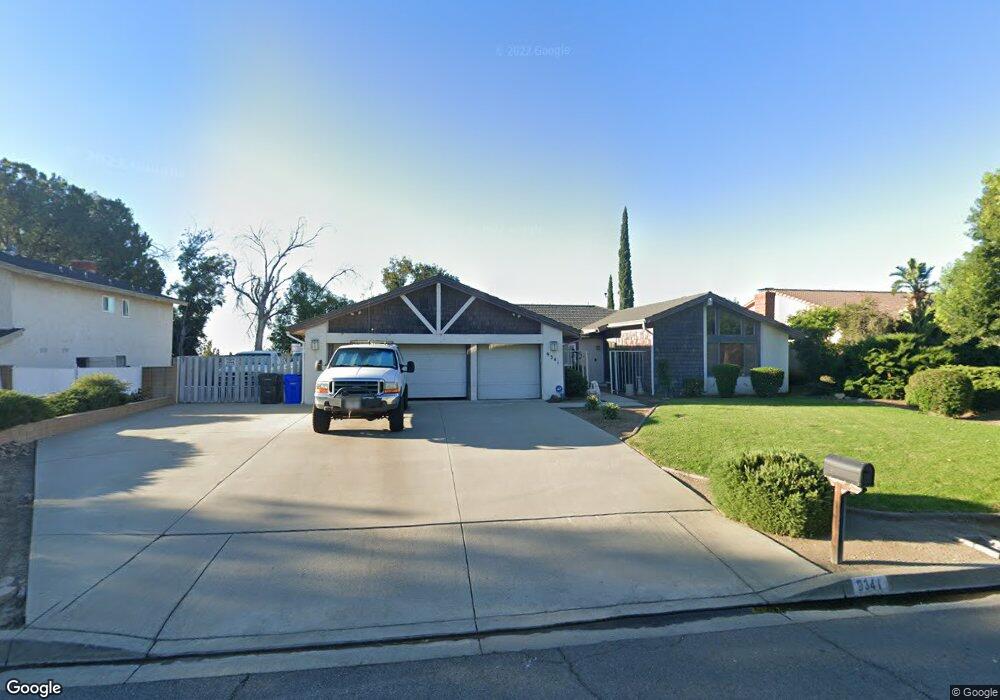
9341 Rancho St Rancho Cucamonga, CA 91737
Alta Loma NeighborhoodEstimated Value: $1,018,741 - $1,256,000
4
Beds
3
Baths
2,192
Sq Ft
$531/Sq Ft
Est. Value
About This Home
This home is located at 9341 Rancho St, Rancho Cucamonga, CA 91737 and is currently estimated at $1,163,185, approximately $530 per square foot. 9341 Rancho St is a home located in San Bernardino County with nearby schools including Floyd M. Stork Elementary, Alta Loma Junior High, and Los Osos High.
Ownership History
Date
Name
Owned For
Owner Type
Purchase Details
Closed on
Dec 13, 2005
Sold by
Gattas Robert
Bought by
Gattas Robert James and Gattas Sharon Michele
Current Estimated Value
Home Financials for this Owner
Home Financials are based on the most recent Mortgage that was taken out on this home.
Original Mortgage
$360,500
Outstanding Balance
$201,942
Interest Rate
6.31%
Mortgage Type
New Conventional
Estimated Equity
$961,243
Purchase Details
Closed on
Mar 7, 2000
Sold by
Huff William J
Bought by
Gattas Robert and Gattas Sharon
Home Financials for this Owner
Home Financials are based on the most recent Mortgage that was taken out on this home.
Original Mortgage
$256,000
Interest Rate
8.3%
Mortgage Type
Stand Alone First
Purchase Details
Closed on
Jul 22, 1996
Sold by
Proctor Carl L and Proctor Theresa M
Bought by
Huff William J and Huff Lori J
Home Financials for this Owner
Home Financials are based on the most recent Mortgage that was taken out on this home.
Original Mortgage
$207,000
Interest Rate
8.2%
Mortgage Type
Balloon
Create a Home Valuation Report for This Property
The Home Valuation Report is an in-depth analysis detailing your home's value as well as a comparison with similar homes in the area
Home Values in the Area
Average Home Value in this Area
Purchase History
| Date | Buyer | Sale Price | Title Company |
|---|---|---|---|
| Gattas Robert James | -- | First American Title Company | |
| Gattas Robert | $320,000 | Fidelity National Title | |
| Huff William J | $250,000 | Fidelity National Title Co |
Source: Public Records
Mortgage History
| Date | Status | Borrower | Loan Amount |
|---|---|---|---|
| Open | Gattas Robert James | $360,500 | |
| Closed | Gattas Robert | $256,000 | |
| Previous Owner | Huff William J | $207,000 | |
| Closed | Gattas Robert | $32,000 |
Source: Public Records
Tax History
| Year | Tax Paid | Tax Assessment Tax Assessment Total Assessment is a certain percentage of the fair market value that is determined by local assessors to be the total taxable value of land and additions on the property. | Land | Improvement |
|---|---|---|---|---|
| 2025 | $5,388 | $491,840 | $172,144 | $319,696 |
| 2024 | $5,252 | $482,196 | $168,769 | $313,427 |
| 2023 | $5,132 | $472,741 | $165,460 | $307,281 |
| 2022 | $5,118 | $463,472 | $162,216 | $301,256 |
| 2021 | $5,114 | $454,384 | $159,035 | $295,349 |
| 2020 | $4,903 | $449,725 | $157,404 | $292,321 |
| 2019 | $4,958 | $440,907 | $154,318 | $286,589 |
| 2018 | $4,845 | $432,262 | $151,292 | $280,970 |
| 2017 | $4,623 | $423,786 | $148,325 | $275,461 |
| 2016 | $4,496 | $415,477 | $145,417 | $270,060 |
| 2015 | $4,466 | $409,236 | $143,233 | $266,003 |
| 2014 | $4,338 | $401,219 | $140,427 | $260,792 |
Source: Public Records
Map
Nearby Homes
- 9165 Camellia Ct
- 9220 Camellia Ct
- 9227 Camellia Ct
- 9201 Camellia Ct
- 9209 Camellia Ct
- 9210 Camellia Ct
- 9230 Camellia Ct
- 9219 Camellia Ct
- 9239 Camellia Ct
- 9149 Whirlaway Ct
- 8979 Camellia Ct
- 9111 Hidden Farm Rd
- 5836 Buckthorn Ave
- 8851 Beechwood Dr
- 5848 Burlwood Ct
- 5895 Jadeite Ave
- 9620 Hidden Farm Rd
- 6087 Amethyst St
- 9221 Banyan St
- 8798 Justify Dr
- 9327 Rancho St
- 9353 Rancho St
- 9313 Rancho St
- 9369 Rancho St
- 5591 Hellman Ave
- 5615 Hellman Ave
- 9344 Rancho St
- 9383 Rancho St
- 9328 Rancho St
- 9358 Rancho St
- 9312 Rancho St
- 5625 Hellman Ave
- 9374 Rancho St
- 9395 Rancho St
- 9280 Ioamosa Ct
- 9390 Rancho St
- 9261 Rancho St
- 9409 Rancho St
- 9345 Hillside Rd
- 9331 Hillside Rd
Your Personal Tour Guide
Ask me questions while you tour the home.