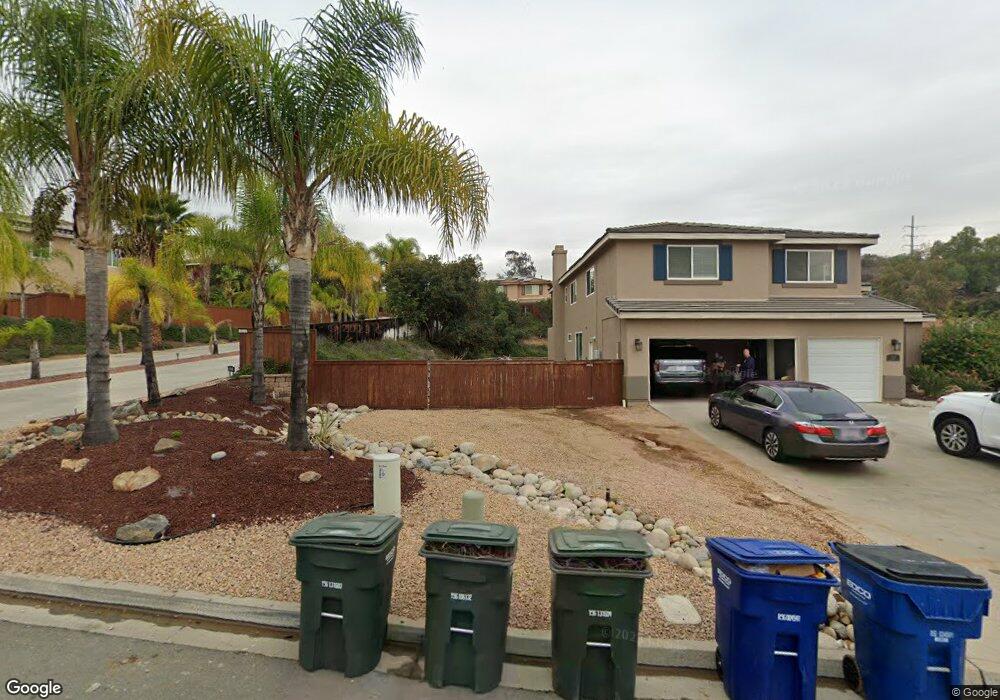
9342 Audubon Rd Lakeside, CA 92040
Estimated Value: $1,178,000 - $1,295,000
4
Beds
3
Baths
3,493
Sq Ft
$351/Sq Ft
Est. Value
About This Home
This home is located at 9342 Audubon Rd, Lakeside, CA 92040 and is currently estimated at $1,225,906, approximately $350 per square foot. 9342 Audubon Rd is a home located in San Diego County with nearby schools including Lakeview Elementary School, Tierra Del Sol Middle School, and El Capitan High School.
Ownership History
Date
Name
Owned For
Owner Type
Purchase Details
Closed on
Feb 14, 2013
Sold by
Faigin Robert P and Faigin Brooke E
Bought by
Faigin Robert P and Faigin Brooke E
Current Estimated Value
Purchase Details
Closed on
Dec 14, 2012
Sold by
Oedewaldt Larry and Oedewaldt Amy
Bought by
Faigin Robert P and Faigin Brooke E
Home Financials for this Owner
Home Financials are based on the most recent Mortgage that was taken out on this home.
Original Mortgage
$417,000
Outstanding Balance
$287,549
Interest Rate
3.27%
Mortgage Type
New Conventional
Estimated Equity
$938,357
Purchase Details
Closed on
Nov 8, 2004
Sold by
Kennedy Development Of California Lp
Bought by
Oedewaldt Larry and Oedewaldt Amy
Home Financials for this Owner
Home Financials are based on the most recent Mortgage that was taken out on this home.
Original Mortgage
$555,796
Interest Rate
5.65%
Mortgage Type
Purchase Money Mortgage
Create a Home Valuation Report for This Property
The Home Valuation Report is an in-depth analysis detailing your home's value as well as a comparison with similar homes in the area
Home Values in the Area
Average Home Value in this Area
Purchase History
| Date | Buyer | Sale Price | Title Company |
|---|---|---|---|
| Faigin Robert P | -- | None Available | |
| Faigin Robert P | $465,000 | Corinthian Title Company | |
| Oedewaldt Larry | $695,000 | Lawyers Title |
Source: Public Records
Mortgage History
| Date | Status | Borrower | Loan Amount |
|---|---|---|---|
| Open | Faigin Robert P | $417,000 | |
| Previous Owner | Oedewaldt Larry | $555,796 | |
| Closed | Oedewaldt Larry | $94,204 |
Source: Public Records
Tax History
| Year | Tax Paid | Tax Assessment Tax Assessment Total Assessment is a certain percentage of the fair market value that is determined by local assessors to be the total taxable value of land and additions on the property. | Land | Improvement |
|---|---|---|---|---|
| 2025 | $7,352 | $572,602 | $172,394 | $400,208 |
| 2024 | $7,352 | $561,375 | $169,014 | $392,361 |
| 2023 | $7,081 | $550,368 | $165,700 | $384,668 |
| 2022 | $6,950 | $539,577 | $162,451 | $377,126 |
| 2021 | $6,856 | $528,998 | $159,266 | $369,732 |
| 2020 | $6,742 | $523,574 | $157,633 | $365,941 |
| 2019 | $6,615 | $513,309 | $154,543 | $358,766 |
| 2018 | $6,491 | $503,245 | $151,513 | $351,732 |
| 2017 | $821 | $493,379 | $148,543 | $344,836 |
| 2016 | $6,163 | $483,706 | $145,631 | $338,075 |
| 2015 | $6,126 | $476,441 | $143,444 | $332,997 |
| 2014 | $5,831 | $467,110 | $140,635 | $326,475 |
Source: Public Records
Map
Nearby Homes
- 9227 Colorama Way
- 13625 Darryl Ct
- 9500 Harritt Rd Unit 230
- 9500 Harritt Rd Unit 99
- 9500 Harritt Rd Unit 31
- 9500 Harritt Rd Unit SPC 189
- 9500 Harritt Rd Unit SPC 190
- 13256 W Lakeview Rd
- 13594 Highway 8 Business Unit 33
- 13594 Highway 8 Business Unit 37
- 13403 Bubbling Ln
- 13803 Pinkard Way Unit 15
- 13655 Highway 8 Business Unit SPC 24
- 13490 Highway 8 Business Unit SPC 24
- 13490 Highway 8 Business Unit 3
- 13490 Highway 8 Business
- 13490 Highway 8 Business Unit 105
- 13890 Pinkard Way Unit 68
- 9395 Harritt Rd Unit SPC 131
- 9395 Harritt Rd Unit 215
- 9330 Audubon Rd
- 9362 Audubon Rd
- 9354 Audubon Rd
- 9318 Audubon Rd
- 9366 Audubon Rd
- 9306 Audubon Rd
- 9359 Audubon Rd
- 13538 Adlai Ln
- 9385 Adlai Rd
- 9307 Audubon Rd
- 13532 Adlai Ln
- 9410 Adlai Terrace
- 13550 Adlai Ln
- 9354 Adlai Rd
- 13568 Adlai Ln
- 13503 Adlai Ln
- 13509 Adlai Ln
- 9409 Adlai Terrace
- 9418 Adlai Terrace
- 9340 Adlai Rd
Your Personal Tour Guide
Ask me questions while you tour the home.