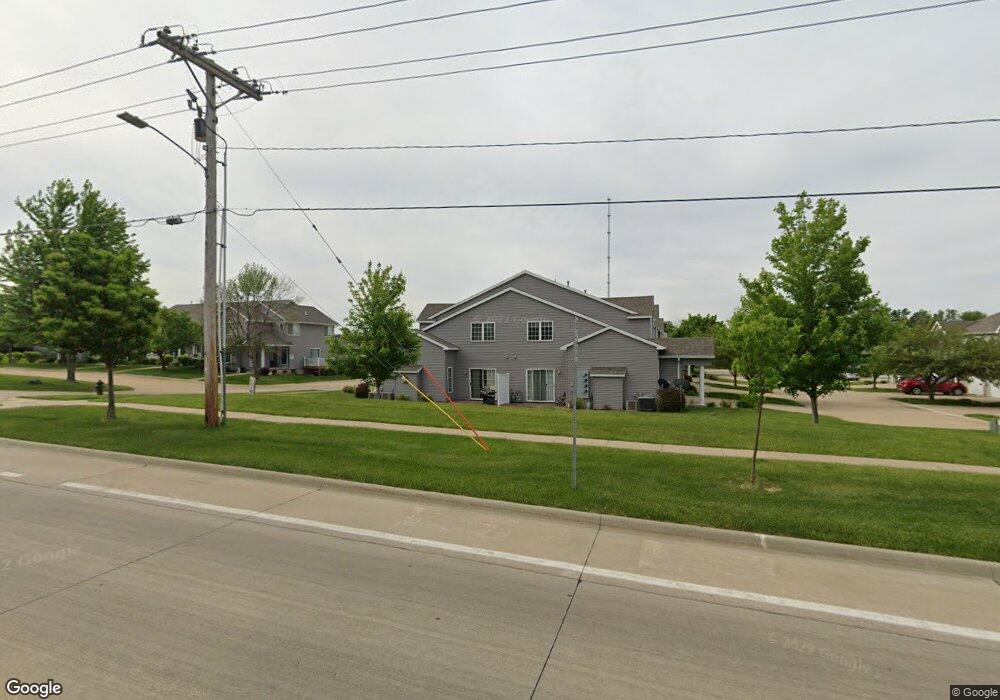
935 74th St NE Unit E2 Cedar Rapids, IA 52402
Estimated Value: $171,000 - $181,000
2
Beds
2
Baths
1,204
Sq Ft
$147/Sq Ft
Est. Value
About This Home
This home is located at 935 74th St NE Unit E2, Cedar Rapids, IA 52402 and is currently estimated at $176,504, approximately $146 per square foot. 935 74th St NE Unit E2 is a home located in Linn County with nearby schools including Westfield Elementary School, Oak Ridge School, and Linn-Mar High School.
Ownership History
Date
Name
Owned For
Owner Type
Purchase Details
Closed on
Oct 7, 2015
Sold by
Spinden David and Spinden Emily
Bought by
Sigwarth Julie A
Current Estimated Value
Home Financials for this Owner
Home Financials are based on the most recent Mortgage that was taken out on this home.
Original Mortgage
$98,720
Outstanding Balance
$77,538
Interest Rate
3.91%
Mortgage Type
Closed End Mortgage
Estimated Equity
$98,966
Purchase Details
Closed on
Feb 20, 2006
Sold by
Savage David L and Savage Ann H
Bought by
Spinden David
Home Financials for this Owner
Home Financials are based on the most recent Mortgage that was taken out on this home.
Original Mortgage
$93,720
Interest Rate
6.2%
Mortgage Type
Fannie Mae Freddie Mac
Purchase Details
Closed on
Nov 25, 1998
Sold by
Greystone Courtyard Development Lc
Bought by
Savage David L and Savage Ann H
Home Financials for this Owner
Home Financials are based on the most recent Mortgage that was taken out on this home.
Original Mortgage
$75,900
Interest Rate
7.01%
Create a Home Valuation Report for This Property
The Home Valuation Report is an in-depth analysis detailing your home's value as well as a comparison with similar homes in the area
Purchase History
| Date | Buyer | Sale Price | Title Company |
|---|---|---|---|
| Sigwarth Julie A | $123,500 | None Available | |
| Spinden David | $117,000 | None Available | |
| Savage David L | $94,500 | -- |
Source: Public Records
Mortgage History
| Date | Status | Borrower | Loan Amount |
|---|---|---|---|
| Open | Sigwarth Julie A | $98,720 | |
| Previous Owner | Spinden David | $93,720 | |
| Previous Owner | Savage David L | $75,900 |
Source: Public Records
Tax History
| Year | Tax Paid | Tax Assessment Tax Assessment Total Assessment is a certain percentage of the fair market value that is determined by local assessors to be the total taxable value of land and additions on the property. | Land | Improvement |
|---|---|---|---|---|
| 2025 | $3,206 | $177,900 | $20,500 | $157,400 |
| 2024 | $3,506 | $174,100 | $20,500 | $153,600 |
| 2023 | $3,506 | $174,100 | $20,500 | $153,600 |
| 2022 | $3,394 | $162,300 | $20,500 | $141,800 |
| 2021 | $3,100 | $162,300 | $20,500 | $141,800 |
| 2020 | $3,100 | $140,600 | $16,000 | $124,600 |
| 2019 | $2,896 | $133,200 | $16,000 | $117,200 |
Source: Public Records
Map
Nearby Homes
- 935 74th St NE Unit 1
- 1055 74th St NE Unit 1055
- 808 Crescent View Dr NE
- 953 Acacia Dr NE
- 6965 Doubletree Rd NE Unit 6965
- 1008 Doubletree Ct NE Unit 1008
- 1241 74th St NE Unit 1241
- 629 Winterberry Place NE Unit 629
- 7113 W Park Rd NE
- 929 Messina Dr NE
- 6715 Creekside Dr NE Unit 2
- 1407 Tower Ln NE Unit 1407
- 6430 Creekside Dr NE Unit 4
- 6410 Creekside Dr NE Unit 2
- 1450 Tower Ln NE Unit 16
- 1472 Tower Ln NE Unit 5
- 6807 Kingswood Ln NE
- 6812 Kelburn Ln NE
- 1426 Crossings Ct NE
- 709 Arrowhead Ln NE
- 935 74th St NE Unit E5
- 935 74th St NE
- 935 74th St NE
- 935 74th St NE Unit E1
- 935 74th St NE
- 935 74th St NE Unit 4
- 935 74th St NE Unit 2
- 943 74th St NE Unit D7
- 943 74th St NE Unit D6
- 943 74th St NE
- 943 74th St NE
- 943 74th St NE Unit D3
- 943 74th St NE
- 943 74th St NE Unit D1
- 943 74th St NE
- 943 74th St NE Unit 6
- 943 74th St NE Unit 3
- 943 74th St NE Unit 1
- 943 74th St NE Unit 2
- 943 74th St NE
Your Personal Tour Guide
Ask me questions while you tour the home.