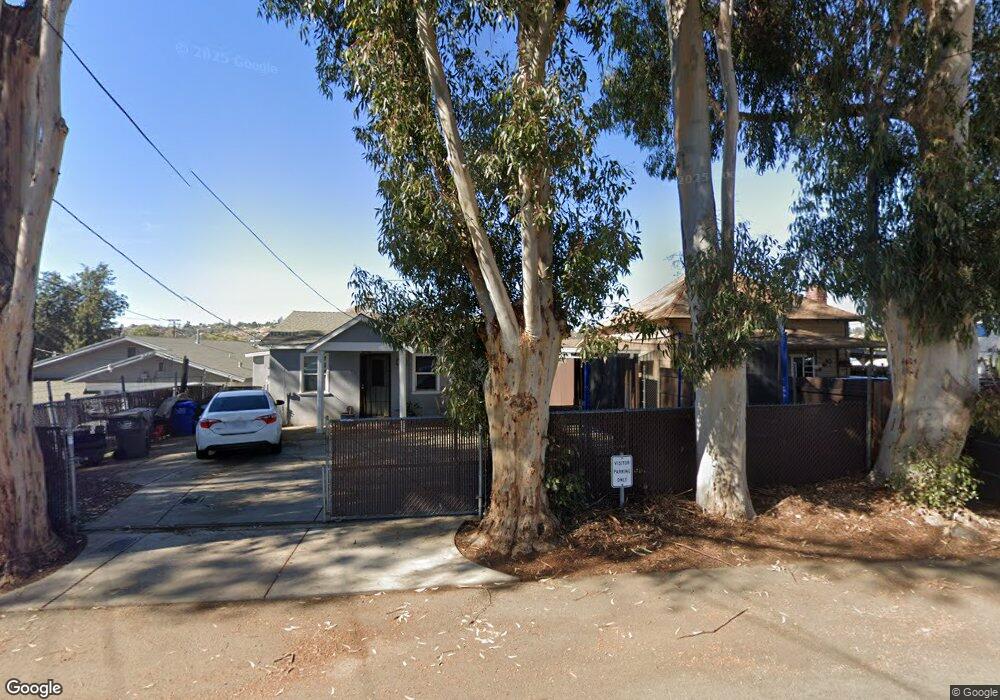
935 B St Ramona, CA 92065
Estimated Value: $395,000 - $460,000
2
Beds
1
Bath
624
Sq Ft
$687/Sq Ft
Est. Value
About This Home
This home is located at 935 B St, Ramona, CA 92065 and is currently estimated at $428,850, approximately $687 per square foot. 935 B St is a home located in San Diego County with nearby schools including Ramona Elementary School, Olive Peirce Middle School, and Ramona High School.
Ownership History
Date
Name
Owned For
Owner Type
Purchase Details
Closed on
Jun 2, 2014
Sold by
Henry Martin L
Bought by
The Henry Family Trust and Henry Refugio A
Current Estimated Value
Purchase Details
Closed on
Oct 23, 2012
Sold by
Dawson Perry A and Alexander Jill
Bought by
Henry Martin L
Purchase Details
Closed on
Nov 14, 1996
Sold by
John Marsili
Bought by
Dawson Perry A and Alexander Jill
Home Financials for this Owner
Home Financials are based on the most recent Mortgage that was taken out on this home.
Original Mortgage
$54,000
Interest Rate
7.59%
Mortgage Type
Seller Take Back
Create a Home Valuation Report for This Property
The Home Valuation Report is an in-depth analysis detailing your home's value as well as a comparison with similar homes in the area
Home Values in the Area
Average Home Value in this Area
Purchase History
| Date | Buyer | Sale Price | Title Company |
|---|---|---|---|
| The Henry Family Trust | -- | None Available | |
| Henry Martin L | $145,000 | Equity Title Company | |
| Dawson Perry A | $60,000 | First American Title Ins Co |
Source: Public Records
Mortgage History
| Date | Status | Borrower | Loan Amount |
|---|---|---|---|
| Previous Owner | Dawson Perry A | $54,000 |
Source: Public Records
Tax History
| Year | Tax Paid | Tax Assessment Tax Assessment Total Assessment is a certain percentage of the fair market value that is determined by local assessors to be the total taxable value of land and additions on the property. | Land | Improvement |
|---|---|---|---|---|
| 2025 | $2,074 | $178,547 | $123,138 | $55,409 |
| 2024 | $2,074 | $175,047 | $120,724 | $54,323 |
| 2023 | $1,844 | $171,615 | $118,357 | $53,258 |
| 2022 | $2,005 | $168,251 | $116,037 | $52,214 |
| 2021 | $1,978 | $164,953 | $113,762 | $51,191 |
| 2020 | $1,962 | $163,263 | $112,596 | $50,667 |
| 2019 | $1,922 | $160,063 | $110,389 | $49,674 |
| 2018 | $1,874 | $156,925 | $108,225 | $48,700 |
| 2017 | $1,841 | $153,849 | $106,103 | $47,746 |
| 2016 | $1,806 | $150,833 | $104,023 | $46,810 |
| 2015 | $1,776 | $148,568 | $102,461 | $46,107 |
| 2014 | $1,739 | $145,658 | $100,454 | $45,204 |
Source: Public Records
Map
Nearby Homes
Your Personal Tour Guide
Ask me questions while you tour the home.