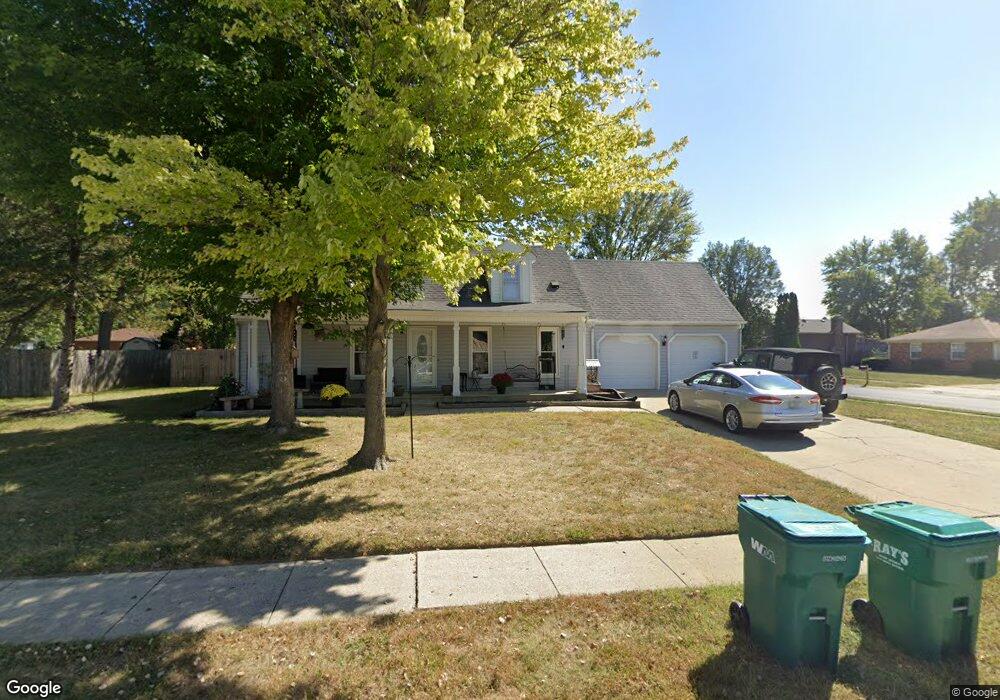
935 Briarwood Dr Brownsburg, IN 46112
Estimated Value: $316,000 - $341,000
4
Beds
2
Baths
2,080
Sq Ft
$157/Sq Ft
Est. Value
About This Home
This home is located at 935 Briarwood Dr, Brownsburg, IN 46112 and is currently estimated at $326,494, approximately $156 per square foot. 935 Briarwood Dr is a home located in Hendricks County with nearby schools including Delaware Trail Elementary School, Brownsburg East Middle School, and Brownsburg High School.
Ownership History
Date
Name
Owned For
Owner Type
Purchase Details
Closed on
Jun 8, 2015
Sold by
Oldenkamp Jared
Bought by
Hartsock Tammy A
Current Estimated Value
Home Financials for this Owner
Home Financials are based on the most recent Mortgage that was taken out on this home.
Original Mortgage
$163,975
Outstanding Balance
$129,227
Interest Rate
4.25%
Mortgage Type
FHA
Estimated Equity
$197,267
Purchase Details
Closed on
Feb 13, 2013
Sold by
Degolyer Gary D and Degolyer Bonnie J
Bought by
Oldenkamp Jared
Home Financials for this Owner
Home Financials are based on the most recent Mortgage that was taken out on this home.
Original Mortgage
$141,391
Interest Rate
3.25%
Mortgage Type
FHA
Purchase Details
Closed on
Jul 19, 2012
Sold by
Wathen Rian E and Wathen Lisa E
Bought by
Degolyer Gary D and Degolyer Bonnie J
Purchase Details
Closed on
Mar 16, 2005
Sold by
Wathen Rian E and Wathen Lisa E
Bought by
White Oleander Llc
Create a Home Valuation Report for This Property
The Home Valuation Report is an in-depth analysis detailing your home's value as well as a comparison with similar homes in the area
Home Values in the Area
Average Home Value in this Area
Purchase History
| Date | Buyer | Sale Price | Title Company |
|---|---|---|---|
| Hartsock Tammy A | -- | Chicago Title | |
| Oldenkamp Jared | -- | None Available | |
| Degolyer Gary D | $62,400 | None Available | |
| White Oleander Llc | -- | None Available |
Source: Public Records
Mortgage History
| Date | Status | Borrower | Loan Amount |
|---|---|---|---|
| Open | Hartsock Tammy A | $163,975 | |
| Previous Owner | Oldenkamp Jared | $141,391 |
Source: Public Records
Tax History Compared to Growth
Tax History
| Year | Tax Paid | Tax Assessment Tax Assessment Total Assessment is a certain percentage of the fair market value that is determined by local assessors to be the total taxable value of land and additions on the property. | Land | Improvement |
|---|---|---|---|---|
| 2024 | $2,743 | $274,300 | $37,400 | $236,900 |
| 2023 | $2,569 | $255,100 | $34,000 | $221,100 |
| 2022 | $2,231 | $225,600 | $32,800 | $192,800 |
| 2021 | $1,957 | $198,300 | $30,900 | $167,400 |
| 2020 | $1,844 | $187,400 | $30,900 | $156,500 |
| 2019 | $1,741 | $176,400 | $28,500 | $147,900 |
| 2018 | $1,629 | $156,100 | $31,600 | $124,500 |
| 2017 | $1,567 | $149,100 | $30,400 | $118,700 |
| 2016 | $1,523 | $144,000 | $30,400 | $113,600 |
| 2014 | $1,372 | $135,300 | $29,500 | $105,800 |
| 2013 | $1,409 | $138,700 | $28,900 | $109,800 |
Source: Public Records
Map
Nearby Homes
- 1212 Willow Springs Blvd
- 146 Dover Blvd N
- 1215 Willow Springs Blvd
- 117 Prairie Pkwy
- 1290 Hideaway Ln
- 7643 Sagamore Dr
- 7657 Sagamore Dr
- 1432 Hideaway Cir
- 1390 Holiday Ln E
- 370 Vinewood Dr S
- 667 S Alpha Ave
- 470 Sycamore St
- 388 Vinewood Dr S
- 390 Vinewood Dr N
- 202 Sugar Bush Ln S
- 308 Maplebrook Dr
- 6433 Wings Ct
- 6415 Wings Ct
- 3463 Sunnyvale Dr
- 409 S Grant St
- 931 Briarwood Dr
- 12 Thornleigh Dr
- 15 Thornleigh Dr
- 932 Briarwood Dr
- 927 Briarwood Dr
- 928 Briarwood Dr
- 936 Briarwood Dr
- 11 Thornleigh Dr
- 930 S Green St
- 926 S Green St
- 1009 Briarwood Dr
- 1006 Briarwood Dr
- 1008 S Green St
- 923 Briarwood Dr
- 806 S Green St
- 29 Thornleigh Dr
- 1010 Briarwood Dr
- 136 Briarwood Ct
- 1012 S Green St
- 1013 Briarwood Dr