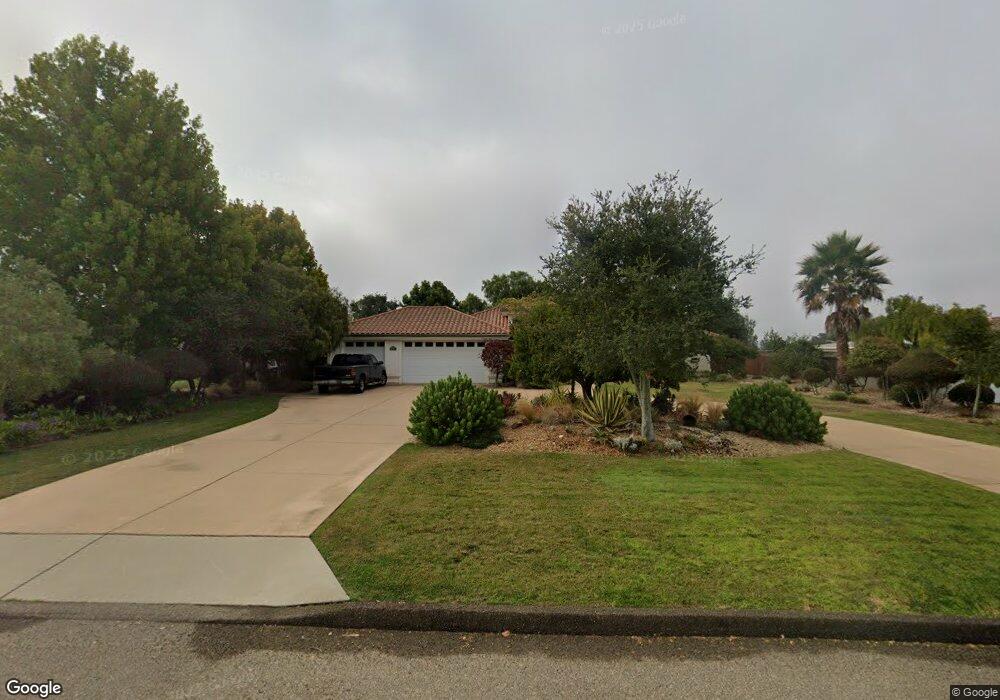
935 Calle Tio Nipomo, CA 93444
Estimated Value: $1,292,000 - $1,609,000
4
Beds
3
Baths
3,100
Sq Ft
$447/Sq Ft
Est. Value
About This Home
This home is located at 935 Calle Tio, Nipomo, CA 93444 and is currently estimated at $1,386,631, approximately $447 per square foot. 935 Calle Tio is a home located in San Luis Obispo County with nearby schools including Dorothea Lange Elementary School, Mesa Middle School, and Nipomo High School.
Ownership History
Date
Name
Owned For
Owner Type
Purchase Details
Closed on
Apr 3, 2024
Sold by
Ambrosio Emilia and Lopez Luis M
Bought by
Lopez Ambrosio Family Trust and Lopez
Current Estimated Value
Purchase Details
Closed on
Nov 9, 2001
Sold by
Nester Greg
Bought by
Lopez Luis M and Ambrosio Emilia
Home Financials for this Owner
Home Financials are based on the most recent Mortgage that was taken out on this home.
Original Mortgage
$580,000
Interest Rate
6%
Create a Home Valuation Report for This Property
The Home Valuation Report is an in-depth analysis detailing your home's value as well as a comparison with similar homes in the area
Home Values in the Area
Average Home Value in this Area
Purchase History
| Date | Buyer | Sale Price | Title Company |
|---|---|---|---|
| Lopez Ambrosio Family Trust | -- | None Listed On Document | |
| Lopez Luis M | $581,000 | First American Title Co |
Source: Public Records
Mortgage History
| Date | Status | Borrower | Loan Amount |
|---|---|---|---|
| Previous Owner | Lopez Luis M | $580,000 |
Source: Public Records
Tax History Compared to Growth
Tax History
| Year | Tax Paid | Tax Assessment Tax Assessment Total Assessment is a certain percentage of the fair market value that is determined by local assessors to be the total taxable value of land and additions on the property. | Land | Improvement |
|---|---|---|---|---|
| 2025 | $9,143 | $896,065 | $251,127 | $644,938 |
| 2024 | $9,037 | $878,496 | $246,203 | $632,293 |
| 2023 | $9,037 | $861,272 | $241,376 | $619,896 |
| 2022 | $8,899 | $844,386 | $236,644 | $607,742 |
| 2021 | $8,882 | $827,830 | $232,004 | $595,826 |
| 2020 | $8,779 | $819,343 | $229,626 | $589,717 |
| 2019 | $8,724 | $803,278 | $225,124 | $578,154 |
| 2018 | $8,619 | $787,528 | $220,710 | $566,818 |
| 2017 | $8,456 | $772,087 | $216,383 | $555,704 |
| 2016 | $7,973 | $756,949 | $212,141 | $544,808 |
| 2015 | $7,858 | $745,580 | $208,955 | $536,625 |
| 2014 | $7,565 | $730,976 | $204,862 | $526,114 |
Source: Public Records
Map
Nearby Homes
- 940 Calle Fresa
- 1150 Redberry Place
- 1225 Dawn Rd
- 1060 Dawn Rd
- 1010 1012 Upper Los Berros Rd
- 639 Barberry Way
- 620 Camino Roble
- 1337 Black Sage Cir
- 615 Sweet Donna Place
- 1024 Maggie Ln
- 1354 Trail View Place
- 7855 Suey Creek Rd
- 1276 Pomeroy Rd
- 1084 Emma Ln
- 875 Camino Caballo
- 1255 Viva Way
- 219 Lema Dr
- 1441 Vicki Ln
- 217 Hope Way
- 231 Trevino Dr