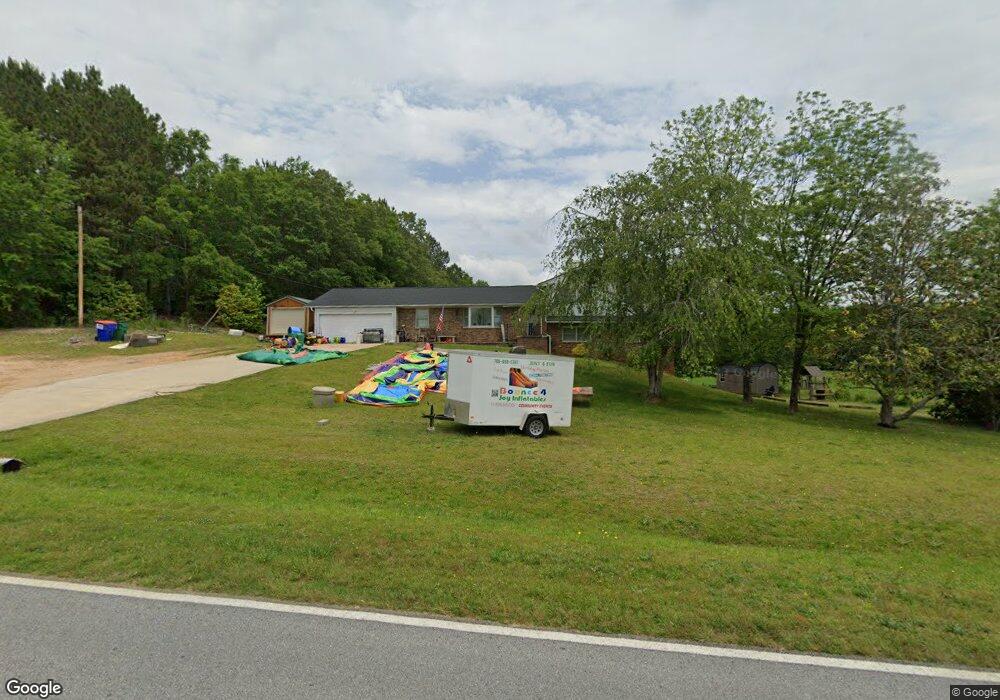
935 Carnes Creek Rd Toccoa, GA 30577
Estimated Value: $338,000 - $442,000
4
Beds
5
Baths
2,637
Sq Ft
$145/Sq Ft
Est. Value
About This Home
This home is located at 935 Carnes Creek Rd, Toccoa, GA 30577 and is currently estimated at $381,703, approximately $144 per square foot. 935 Carnes Creek Rd is a home located in Stephens County with nearby schools including Stephens County High School.
Ownership History
Date
Name
Owned For
Owner Type
Purchase Details
Closed on
May 26, 2021
Sold by
Colon Lillian
Bought by
Colon Joe
Current Estimated Value
Purchase Details
Closed on
Jul 25, 2018
Sold by
Alley
Bought by
Colon Lillian
Home Financials for this Owner
Home Financials are based on the most recent Mortgage that was taken out on this home.
Original Mortgage
$170,000
Interest Rate
4.5%
Mortgage Type
VA
Purchase Details
Closed on
Mar 22, 2018
Sold by
Holland Shelby
Bought by
Alley
Home Financials for this Owner
Home Financials are based on the most recent Mortgage that was taken out on this home.
Original Mortgage
$100,000
Interest Rate
4.4%
Mortgage Type
New Conventional
Purchase Details
Closed on
Mar 7, 2013
Sold by
Holland Shelby
Bought by
Holland Shelby and Dill Sue
Purchase Details
Closed on
Nov 8, 2012
Sold by
Dill Sue Nell
Bought by
Holland Shelby
Purchase Details
Closed on
Dec 31, 2009
Sold by
Dill Sue Nell D
Bought by
Holland Shelby
Purchase Details
Closed on
Apr 1, 1998
Bought by
Dill Sue Nell
Create a Home Valuation Report for This Property
The Home Valuation Report is an in-depth analysis detailing your home's value as well as a comparison with similar homes in the area
Home Values in the Area
Average Home Value in this Area
Purchase History
| Date | Buyer | Sale Price | Title Company |
|---|---|---|---|
| Colon Joe | -- | -- | |
| Colon Lillian | $170,000 | -- | |
| Alley | $50,000 | -- | |
| Holland Shelby | -- | -- | |
| Holland Shelby | -- | -- | |
| Holland Shelby | -- | -- | |
| Dill Sue Nell | -- | -- |
Source: Public Records
Mortgage History
| Date | Status | Borrower | Loan Amount |
|---|---|---|---|
| Previous Owner | Colon Lillian | $170,000 | |
| Previous Owner | Alley | $100,000 |
Source: Public Records
Tax History Compared to Growth
Tax History
| Year | Tax Paid | Tax Assessment Tax Assessment Total Assessment is a certain percentage of the fair market value that is determined by local assessors to be the total taxable value of land and additions on the property. | Land | Improvement |
|---|---|---|---|---|
| 2024 | $3,024 | $99,311 | $4,623 | $94,688 |
| 2023 | $2,586 | $86,865 | $4,623 | $82,242 |
| 2022 | $2,476 | $83,165 | $4,623 | $78,542 |
| 2021 | $2,459 | $78,626 | $4,623 | $74,003 |
| 2020 | $2,480 | $78,537 | $4,623 | $73,914 |
| 2019 | $1,931 | $60,899 | $4,623 | $56,276 |
| 2018 | $1,557 | $49,092 | $4,168 | $44,924 |
| 2017 | $463 | $49,236 | $4,168 | $45,068 |
| 2016 | $461 | $49,236 | $4,168 | $45,068 |
| 2015 | $425 | $47,433 | $4,168 | $43,265 |
| 2014 | $487 | $49,088 | $4,168 | $44,920 |
| 2013 | -- | $49,088 | $4,168 | $44,920 |
Source: Public Records
Map
Nearby Homes
- 9369 Sherwood Ct
- 1662 Carnes Creek Rd
- 266 Cawthon Rd
- 1387 Mize Rd
- 97 Hillside Dr
- 184 Scott Cir
- 151 Richardson St
- 571 N Currahee Ln
- 16 Terri Ln
- 4 Piedmont
- 0 Highway 184 Unit 7606848
- 0 Highway 184 Unit 10547296
- 1037 S Pond St
- 1009 S Pond St
- 215 Old Mize Rd
- 943 S Pond St
- 0 Switchback Run Unit 10437289
- 275 Southern Trace
- 255 Southern Trace
- 48 Owen St
- 1020 Carnes Creek Rd
- 9331 Carnes Creek Rd
- 839 Carnes Creek Rd
- 834 Carnes Creek Rd
- 0 Carnes Creek Rd Unit 7197158
- 0 Carnes Creek Rd Unit 7166380
- 0 Carnes Creek Rd Unit 7091417
- 0 Carnes Creek Rd Unit 8860963
- 0 Carnes Creek Rd
- 797 Carnes Creek Rd
- 760 Carnes Creek Rd
- 745 Carnes Creek Rd
- 739 Carnes Creek Rd
- 682 Carnes Creek Rd
- 1213 Carnes Creek Rd
- 637 Carnes Creek Rd
- 6992 Carnes Creek Rd
- 0 Carnes Creek
- 613 Carnes Creek Rd
- 462 Currahee Cir