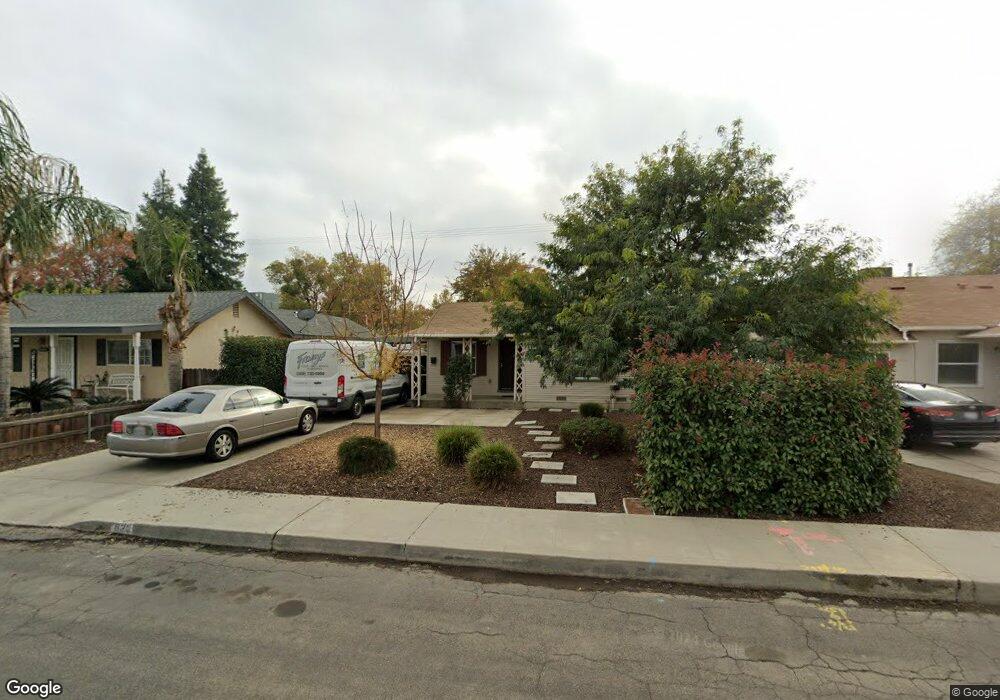
935 E Apricot Ave Tulare, CA 93274
Northeast Tulare NeighborhoodEstimated Value: $187,603 - $243,000
2
Beds
1
Bath
600
Sq Ft
$370/Sq Ft
Est. Value
About This Home
This home is located at 935 E Apricot Ave, Tulare, CA 93274 and is currently estimated at $221,901, approximately $369 per square foot. 935 E Apricot Ave is a home located in Tulare County with nearby schools including Wilson Elementary School, Cherry Avenue Middle School, and Tulare Union High School.
Ownership History
Date
Name
Owned For
Owner Type
Purchase Details
Closed on
Sep 30, 2019
Sold by
Sandifer Jade C
Bought by
Gabriel Jade A
Current Estimated Value
Purchase Details
Closed on
Aug 1, 2016
Sold by
Sandifer Gary
Bought by
Sandifer Jade G
Purchase Details
Closed on
Sep 15, 2003
Sold by
Santiago Marissa D and Vieira Marissa D
Bought by
Sandifer Gary and Sandifer Jade G
Home Financials for this Owner
Home Financials are based on the most recent Mortgage that was taken out on this home.
Original Mortgage
$74,550
Interest Rate
6.4%
Mortgage Type
Stand Alone First
Purchase Details
Closed on
Aug 21, 2001
Sold by
Lawton Stephen R
Bought by
Vieira Marissa D
Home Financials for this Owner
Home Financials are based on the most recent Mortgage that was taken out on this home.
Original Mortgage
$82,760
Interest Rate
6.91%
Mortgage Type
FHA
Create a Home Valuation Report for This Property
The Home Valuation Report is an in-depth analysis detailing your home's value as well as a comparison with similar homes in the area
Home Values in the Area
Average Home Value in this Area
Purchase History
| Date | Buyer | Sale Price | Title Company |
|---|---|---|---|
| Gabriel Jade A | -- | None Available | |
| Sandifer Jade G | -- | None Available | |
| Sandifer Gary | $106,500 | Chicago Title Co | |
| Vieira Marissa D | $83,500 | First American Title Co |
Source: Public Records
Mortgage History
| Date | Status | Borrower | Loan Amount |
|---|---|---|---|
| Previous Owner | Sandifer Gary | $74,550 | |
| Previous Owner | Vieira Marissa D | $82,760 |
Source: Public Records
Tax History
| Year | Tax Paid | Tax Assessment Tax Assessment Total Assessment is a certain percentage of the fair market value that is determined by local assessors to be the total taxable value of land and additions on the property. | Land | Improvement |
|---|---|---|---|---|
| 2025 | $1,648 | $151,423 | $35,544 | $115,879 |
| 2024 | $1,648 | $148,455 | $34,848 | $113,607 |
| 2023 | $1,606 | $145,545 | $34,165 | $111,380 |
| 2022 | $1,559 | $142,693 | $33,496 | $109,197 |
| 2021 | $1,539 | $139,895 | $32,839 | $107,056 |
| 2020 | $1,565 | $138,460 | $32,502 | $105,958 |
| 2019 | $1,300 | $110,000 | $25,000 | $85,000 |
| 2018 | $1,305 | $110,000 | $25,000 | $85,000 |
| 2017 | $1,259 | $105,000 | $28,000 | $77,000 |
| 2016 | $760 | $65,000 | $20,000 | $45,000 |
| 2015 | $758 | $45,000 | $30,000 | $15,000 |
| 2014 | $527 | $45,000 | $30,000 | $15,000 |
Source: Public Records
Map
Nearby Homes
- 1026 E Tulare Ave
- 320 N Blackstone St Unit 14
- 630 Auburn St
- 322 N Dayton St
- 220 S O St
- 2838 Hidden Cove
- 202 N L St
- 1 Spruce St
- 1150 E Ben Franklin Ave
- 1699 E Academy Ave
- 1019 N Manor Dr
- 0 Spruce St S Unit 239148
- 0 Spruce St S Unit 233400
- 421 S Laspina St
- 1240 Hillcrest Ave
- 1142 N Gem St
- 1453 E Sonora Ave
- 1582 E Ben Franklin Ave
- 736 S Spruce St
- 1113 N Manor Dr
- 949 E Apricot Ave
- 927 E Apricot Ave
- 921 E Apricot Ave
- 953 E Apricot Ave
- 934 E San Joaquin Ave
- 919 E Apricot Ave
- 944 E San Joaquin Ave
- 928 E San Joaquin Ave
- 965 E Apricot Ave
- 940 E Apricot Ave
- 920 E San Joaquin Ave
- 948 E San Joaquin Ave
- 944 E Apricot Ave
- 936 E Apricot Ave
- 952 E Apricot Ave
- 905 E Apricot Ave
- 916 E San Joaquin Ave Unit 2
- 916 E San Joaquin Ave
- 970 E San Joaquin Ave
- 979 E Apricot Ave
Your Personal Tour Guide
Ask me questions while you tour the home.