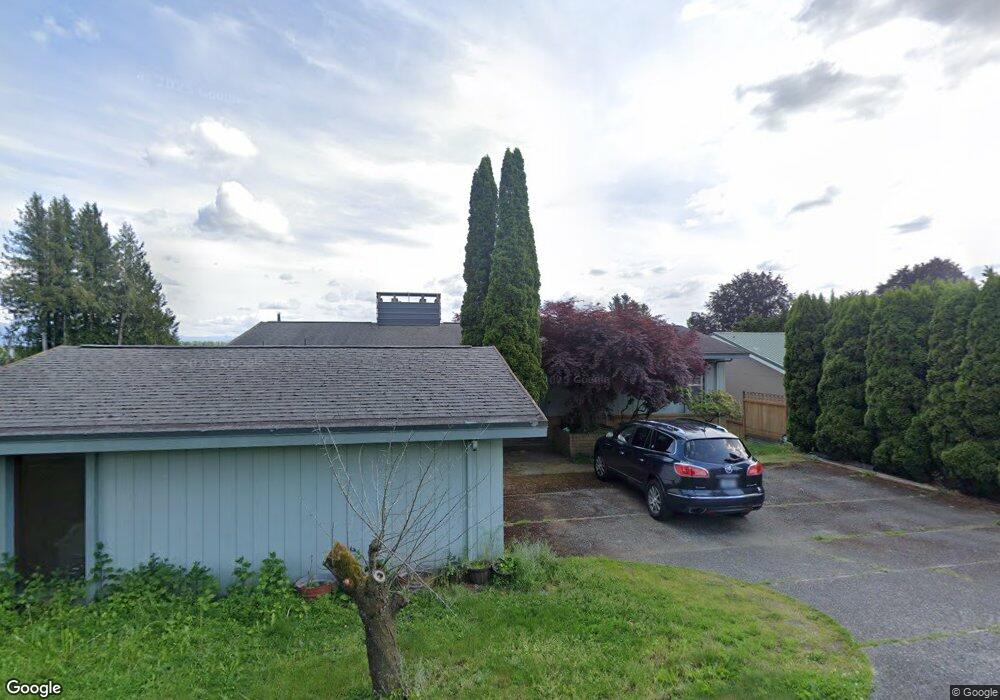
935 E Front St Lynden, WA 98264
Estimated Value: $620,508 - $731,000
3
Beds
4
Baths
1,628
Sq Ft
$418/Sq Ft
Est. Value
About This Home
This home is located at 935 E Front St, Lynden, WA 98264 and is currently estimated at $680,627, approximately $418 per square foot. 935 E Front St is a home located in Whatcom County with nearby schools including Lynden High School, Lynden Christian Schools: Administration, and Lynden Christian School.
Ownership History
Date
Name
Owned For
Owner Type
Purchase Details
Closed on
Jun 14, 2021
Sold by
Eggert Steven K
Bought by
Eggert Steven K
Current Estimated Value
Purchase Details
Closed on
Feb 16, 2010
Sold by
Eggert Steven K and Eggert Florence
Bought by
Eggert Steven K and Eggert Florence
Home Financials for this Owner
Home Financials are based on the most recent Mortgage that was taken out on this home.
Original Mortgage
$213,559
Interest Rate
4.27%
Mortgage Type
New Conventional
Purchase Details
Closed on
Sep 18, 2000
Sold by
Young Donald D
Bought by
Eggert Steven K
Home Financials for this Owner
Home Financials are based on the most recent Mortgage that was taken out on this home.
Original Mortgage
$186,300
Interest Rate
7.98%
Create a Home Valuation Report for This Property
The Home Valuation Report is an in-depth analysis detailing your home's value as well as a comparison with similar homes in the area
Home Values in the Area
Average Home Value in this Area
Purchase History
| Date | Buyer | Sale Price | Title Company |
|---|---|---|---|
| Eggert Steven K | -- | None Available | |
| Eggert Steven K | -- | Mortgage Information Service | |
| Eggert Steven K | $207,000 | First American Title Ins |
Source: Public Records
Mortgage History
| Date | Status | Borrower | Loan Amount |
|---|---|---|---|
| Closed | Eggert Steven K | $213,559 | |
| Closed | Eggert Steven K | $186,300 |
Source: Public Records
Tax History
| Year | Tax Paid | Tax Assessment Tax Assessment Total Assessment is a certain percentage of the fair market value that is determined by local assessors to be the total taxable value of land and additions on the property. | Land | Improvement |
|---|---|---|---|---|
| 2025 | $4,872 | $660,779 | $272,825 | $387,954 |
| 2024 | $4,562 | $642,453 | $242,500 | $399,953 |
| 2023 | $4,562 | $634,570 | $250,000 | $384,570 |
| 2022 | $4,002 | $525,049 | $162,459 | $362,590 |
| 2021 | $3,926 | $433,920 | $134,262 | $299,658 |
| 2020 | $3,439 | $387,439 | $119,880 | $267,559 |
| 2019 | $3,060 | $355,332 | $110,070 | $245,262 |
| 2018 | $3,344 | $324,058 | $100,269 | $223,789 |
| 2017 | $3,254 | $290,870 | $90,000 | $200,870 |
| 2016 | $3,066 | $301,015 | $77,000 | $224,015 |
| 2015 | $2,718 | $282,095 | $74,060 | $208,035 |
| 2014 | -- | $272,540 | $71,540 | $201,000 |
| 2013 | -- | $271,000 | $70,000 | $201,000 |
Source: Public Records
Map
Nearby Homes
- 924 E Grover St
- 1095 Terrace Dr
- 851 Garden Dr
- 137 E Cedar Dr
- 1136 N Cascade Ct
- 0 Bender Rd
- 1125 N Cascade Ct
- 107 Springview Dr
- 214 Skipping Stone Loop
- 208 Skipping Stone Loop
- 220 Skipping Stone Loop
- 204 Skipping Stone Loop
- 167 Cambridge Dr
- 120 Skipping Stone Loop
- 208 Riverwalk Dr
- 116 Riverwalk Dr
- 102 Riverwalk Dr
- 231 Skipping Stone Loop
- 301 S Park St
- 303 Parkside Ct
- 931 E Front St
- 1001 E Front St
- 925 E Front St
- 936 E Grover St
- 930 E Grover St
- 936 E Front St
- 1000 E Grover St
- 1005 E Front St
- 932 E Front St
- 1004 E Grover St
- 930 E Front St
- 918 E Grover St
- 910 E Grover St
- 1008 E Grover St
- 915 E Front St
- 1080 E Front St
- 941 E Grover St
- 1095 E Front St
- 916 E Front St
- 1010 E Grover St
Your Personal Tour Guide
Ask me questions while you tour the home.