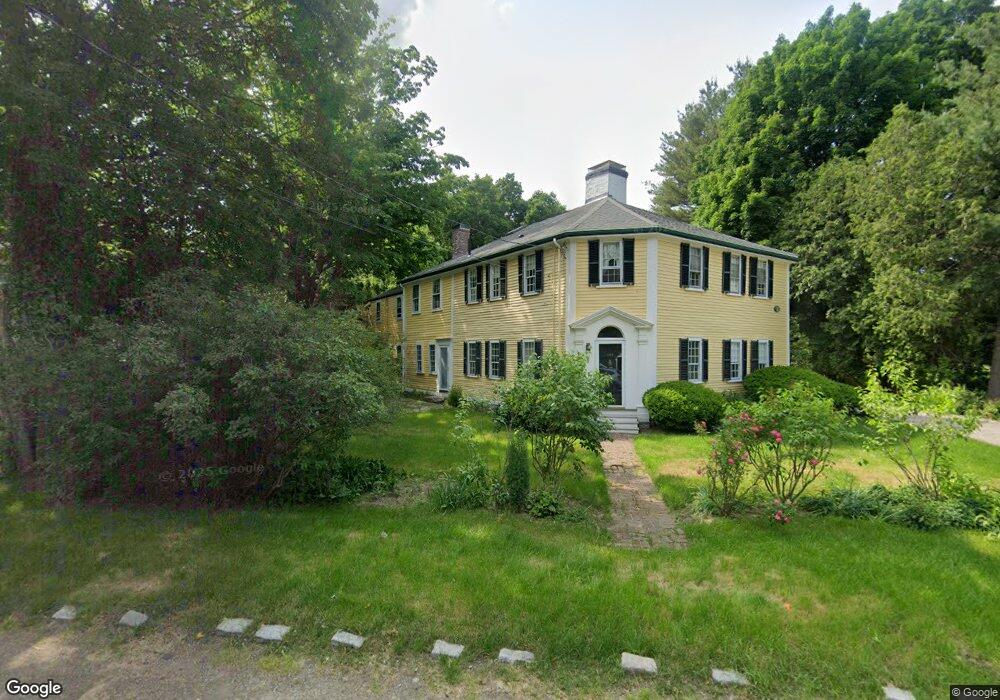
935 High St Dedham, MA 02026
Dexter NeighborhoodEstimated Value: $1,065,000 - $1,802,879
5
Beds
3
Baths
4,004
Sq Ft
$373/Sq Ft
Est. Value
About This Home
This home is located at 935 High St, Dedham, MA 02026 and is currently estimated at $1,494,220, approximately $373 per square foot. 935 High St is a home located in Norfolk County with nearby schools including Riverdale Elementary School, Dedham Middle School, and Dedham High School.
Ownership History
Date
Name
Owned For
Owner Type
Purchase Details
Closed on
Aug 10, 2023
Sold by
Bowers Lt and Bowers
Bought by
Bowers Dedee
Current Estimated Value
Purchase Details
Closed on
Mar 10, 2023
Sold by
Bowers Bruce H and Bowers Dorothy M
Bought by
Bowers Lt and Bowers
Purchase Details
Closed on
Feb 15, 2019
Sold by
Dedham Street Rt and David
Bought by
Xue Lea and Ma Chao
Purchase Details
Closed on
Nov 16, 1972
Bought by
Bowers Bruce H and Bowers Dorothy M
Create a Home Valuation Report for This Property
The Home Valuation Report is an in-depth analysis detailing your home's value as well as a comparison with similar homes in the area
Home Values in the Area
Average Home Value in this Area
Purchase History
| Date | Buyer | Sale Price | Title Company |
|---|---|---|---|
| Bowers Dedee | -- | None Available | |
| Bowers Lt | -- | None Available | |
| Xue Lea | $595,000 | -- | |
| Bowers Bruce H | $43,000 | -- |
Source: Public Records
Mortgage History
| Date | Status | Borrower | Loan Amount |
|---|---|---|---|
| Previous Owner | Bowers Bruce H | $90,000 |
Source: Public Records
Tax History
| Year | Tax Paid | Tax Assessment Tax Assessment Total Assessment is a certain percentage of the fair market value that is determined by local assessors to be the total taxable value of land and additions on the property. | Land | Improvement |
|---|---|---|---|---|
| 2025 | $18,948 | $1,501,400 | $551,100 | $950,300 |
| 2024 | $16,403 | $1,312,200 | $478,600 | $833,600 |
| 2023 | $15,277 | $1,189,800 | $414,100 | $775,700 |
| 2022 | $14,463 | $1,083,400 | $414,100 | $669,300 |
| 2021 | $13,863 | $1,014,100 | $375,200 | $638,900 |
| 2020 | $13,188 | $961,200 | $378,400 | $582,800 |
| 2019 | $13,375 | $945,200 | $398,700 | $546,500 |
| 2018 | $13,927 | $957,200 | $431,100 | $526,100 |
| 2017 | $13,467 | $912,400 | $337,100 | $575,300 |
| 2016 | $12,426 | $802,200 | $295,000 | $507,200 |
| 2015 | $12,993 | $818,700 | $389,000 | $429,700 |
| 2014 | $12,833 | $798,100 | $389,000 | $409,100 |
Source: Public Records
Map
Nearby Homes
- 37 Horrigan Dr Unit 1
- 57 Horrigan Dr Unit 3
- 66 Horrigan Dr Unit 25
- 80 Horrigan Dr Unit 24
- 86 Horrigan Dr Unit 23
- 87 Horrigan Dr Unit 8
- 107 Horrigan Dr Unit 12
- 20-35 Shuttleworth Place
- 20 Shuttleworth Place
- 35 Shuttleworth Place
- 1133 High
- 165 Highland St Unit 165
- 44 Court St
- 262 Meadowbrook Rd
- 55 Church St Unit 1
- 46 Church St
- 92 Old River Place
- 223 Robert Rd
- 441 Washington St Unit 301
- 213 Sandy Valley Rd
- 943 High St
- 943 High St Unit 1
- 927 High St
- 949 High St
- 940 High St
- 950 High Street: Precinct 1
- 915 High St
- 942 High St
- 15 Westfield St
- 961 High St
- 25 Westfield St
- 35 Westfield St
- 5 Polo Field Ln
- 930 High St
- 960 High St: Precinct 1
- 950 High St
- 914 High St
- 914 High St Unit 2
- 914 High St Unit 1
- 916 High St Unit 1
Your Personal Tour Guide
Ask me questions while you tour the home.