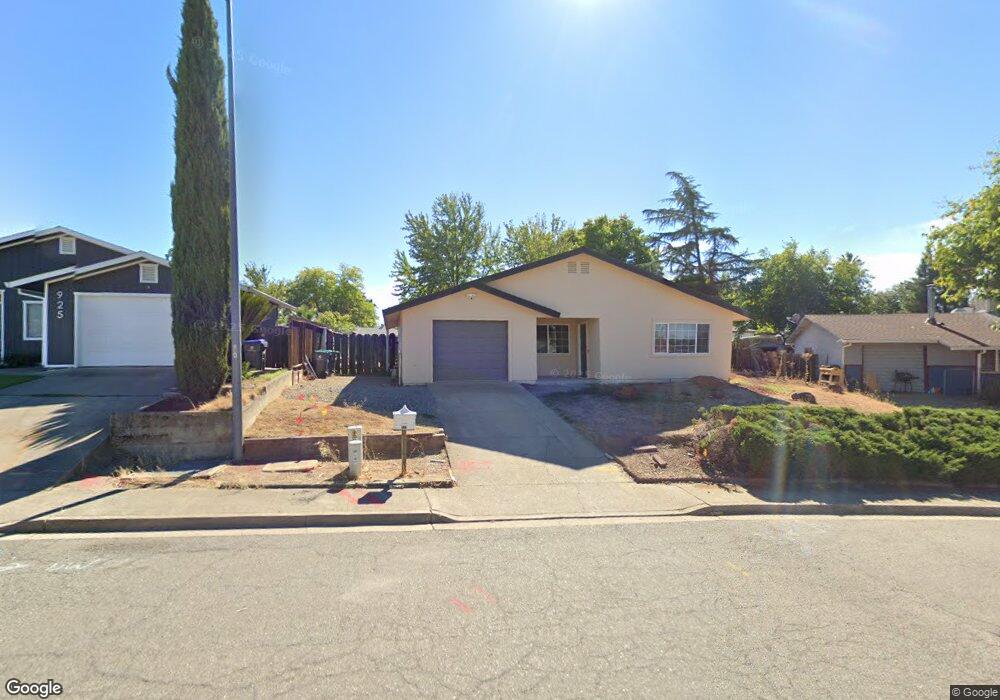
935 Otis Ct Red Bluff, CA 96080
Estimated Value: $282,000 - $313,000
4
Beds
2
Baths
1,322
Sq Ft
$224/Sq Ft
Est. Value
About This Home
This home is located at 935 Otis Ct, Red Bluff, CA 96080 and is currently estimated at $295,881, approximately $223 per square foot. 935 Otis Ct is a home located in Tehama County with nearby schools including William M. Metteer Elementary School, Vista Preparatory Academy, and Red Bluff High School.
Ownership History
Date
Name
Owned For
Owner Type
Purchase Details
Closed on
Jul 15, 2005
Sold by
Bruce Brian E and Bruce Sandra L
Bought by
Bruce Brian and Bruce Sandra Lee
Current Estimated Value
Purchase Details
Closed on
Nov 26, 2001
Sold by
Bruce Ernest W and Bruce Joanne
Bought by
Bruce Brian E and Bruce Sandra L
Purchase Details
Closed on
May 21, 2001
Sold by
Bruce Ernest W and Bruce Joanne
Bought by
Bruce Brian E and Bruce Sandra L
Home Financials for this Owner
Home Financials are based on the most recent Mortgage that was taken out on this home.
Original Mortgage
$64,000
Interest Rate
7.15%
Create a Home Valuation Report for This Property
The Home Valuation Report is an in-depth analysis detailing your home's value as well as a comparison with similar homes in the area
Purchase History
| Date | Buyer | Sale Price | Title Company |
|---|---|---|---|
| Bruce Brian | -- | -- | |
| Bruce Brian E | -- | Fidelity National Title Co | |
| Bruce Brian E | -- | Fidelity National Title Co |
Source: Public Records
Mortgage History
| Date | Status | Borrower | Loan Amount |
|---|---|---|---|
| Previous Owner | Bruce Brian E | $64,000 |
Source: Public Records
Tax History
| Year | Tax Paid | Tax Assessment Tax Assessment Total Assessment is a certain percentage of the fair market value that is determined by local assessors to be the total taxable value of land and additions on the property. | Land | Improvement |
|---|---|---|---|---|
| 2025 | $1,362 | $143,943 | $29,159 | $114,784 |
| 2023 | $1,187 | $113,846 | $28,028 | $85,818 |
| 2022 | $1,179 | $111,615 | $27,479 | $84,136 |
| 2021 | $1,132 | $109,428 | $26,941 | $82,487 |
| 2020 | $1,156 | $108,307 | $26,665 | $81,642 |
| 2019 | $1,163 | $106,185 | $26,143 | $80,042 |
| 2018 | $1,076 | $104,104 | $25,631 | $78,473 |
| 2017 | $1,085 | $102,064 | $25,129 | $76,935 |
| 2016 | $1,014 | $100,064 | $24,637 | $75,427 |
| 2015 | -- | $98,562 | $24,267 | $74,295 |
| 2014 | $984 | $96,632 | $23,792 | $72,840 |
Source: Public Records
Map
Nearby Homes
- 1212 S Jackson St
- 10.94 S Jackson St
- 1210 Wetter Way
- 1160 Orange St
- 425 S Jackson St
- 406 S Jackson St
- 10.04 Vista Way
- 56.19 Vista Way
- 1235 Britt Ln
- 845 Olive St
- 810 Vista Way
- 131 Brookridge Dr Unit 1
- 224 S Jackson St
- 660 Villa Dr
- 1455 Acacia St
- 1480 Leonard Ln
- 1307 Deborah Dr
- 1270 Aloha St
- 910 Aloha St
- 1402 Scottsdale Way
Your Personal Tour Guide
Ask me questions while you tour the home.