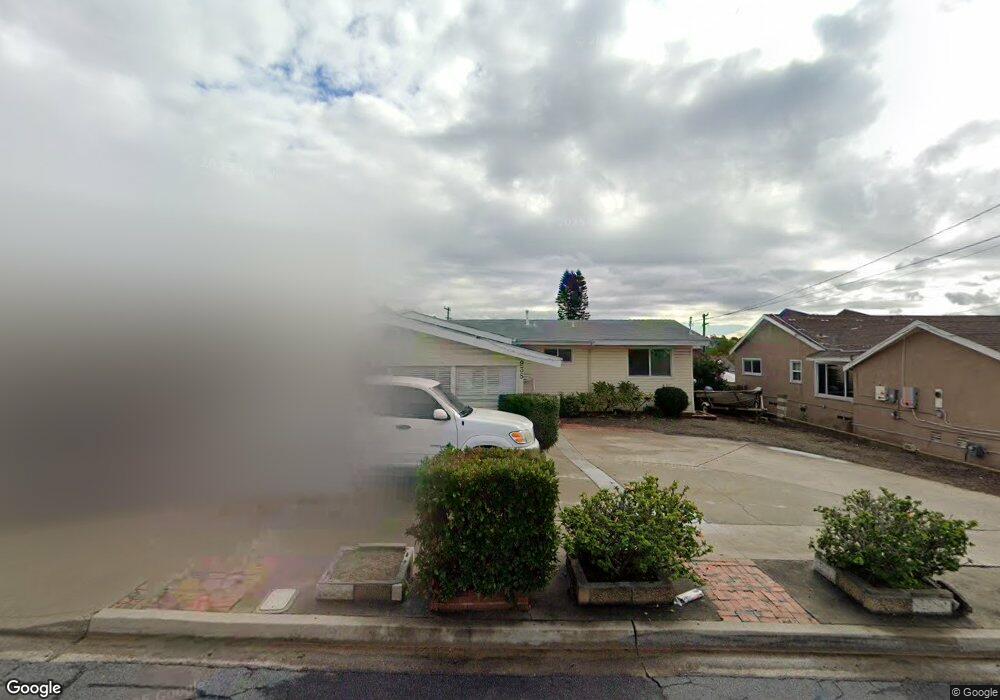
935 Pyramid St San Diego, CA 92114
Emerald Hills NeighborhoodEstimated Value: $698,724 - $890,000
5
Beds
2
Baths
1,174
Sq Ft
$649/Sq Ft
Est. Value
About This Home
This home is located at 935 Pyramid St, San Diego, CA 92114 and is currently estimated at $761,681, approximately $648 per square foot. 935 Pyramid St is a home located in San Diego County with nearby schools including Johnson Elementary School, Millennial Tech Middle School, and Lincoln High School.
Ownership History
Date
Name
Owned For
Owner Type
Purchase Details
Closed on
Mar 29, 2017
Sold by
Robinson Gary I
Bought by
Mesker Joshua Dennis
Current Estimated Value
Home Financials for this Owner
Home Financials are based on the most recent Mortgage that was taken out on this home.
Original Mortgage
$396,316
Outstanding Balance
$326,679
Interest Rate
3.87%
Mortgage Type
FHA
Estimated Equity
$435,002
Purchase Details
Closed on
Jun 26, 2012
Sold by
Robinson Louella M
Bought by
Robonson Gary I
Purchase Details
Closed on
Aug 15, 2002
Sold by
Robinson Louella M
Bought by
Robinson Louella M
Create a Home Valuation Report for This Property
The Home Valuation Report is an in-depth analysis detailing your home's value as well as a comparison with similar homes in the area
Home Values in the Area
Average Home Value in this Area
Purchase History
| Date | Buyer | Sale Price | Title Company |
|---|---|---|---|
| Mesker Joshua Dennis | $410,000 | First American Title | |
| Robonson Gary I | -- | None Available | |
| Robinson Louella M | -- | -- |
Source: Public Records
Mortgage History
| Date | Status | Borrower | Loan Amount |
|---|---|---|---|
| Open | Mesker Joshua Dennis | $396,316 |
Source: Public Records
Tax History Compared to Growth
Tax History
| Year | Tax Paid | Tax Assessment Tax Assessment Total Assessment is a certain percentage of the fair market value that is determined by local assessors to be the total taxable value of land and additions on the property. | Land | Improvement |
|---|---|---|---|---|
| 2025 | $5,779 | $475,833 | $203,099 | $272,734 |
| 2024 | $5,779 | $466,504 | $199,117 | $267,387 |
| 2023 | $5,650 | $457,358 | $195,213 | $262,145 |
| 2022 | $5,500 | $448,391 | $191,386 | $257,005 |
| 2021 | $5,462 | $439,600 | $187,634 | $251,966 |
| 2020 | $5,396 | $435,094 | $185,711 | $249,383 |
| 2019 | $5,300 | $426,564 | $182,070 | $244,494 |
| 2018 | $4,956 | $418,200 | $178,500 | $239,700 |
| 2017 | $80 | $48,725 | $12,319 | $36,406 |
| 2016 | $519 | $47,771 | $12,078 | $35,693 |
| 2015 | $511 | $47,054 | $11,897 | $35,157 |
| 2014 | $502 | $46,133 | $11,664 | $34,469 |
Source: Public Records
Map
Nearby Homes
- 5823 Roswell St
- 525 Pitta St
- 5863 Roswell St
- 6017 Broadway
- 5454 Roswell St
- 6117 Brooklyn Ave
- 962 Hanover St
- 5612 Zircon St
- 510 62nd St Unit 9
- 514 62nd St Unit 19
- 506 62nd St Unit 5
- 5460-68 Imperial Ave
- 5318 Naranja St
- 0 Weaver St
- 5282 Naranja St
- 5282 Naranja St Unit 3
- 402 63rd St Unit 90
- 402 63rd St Unit SPC 59
- 402 63rd St Unit 31
- 1825 Bayview Heights Dr Unit 97