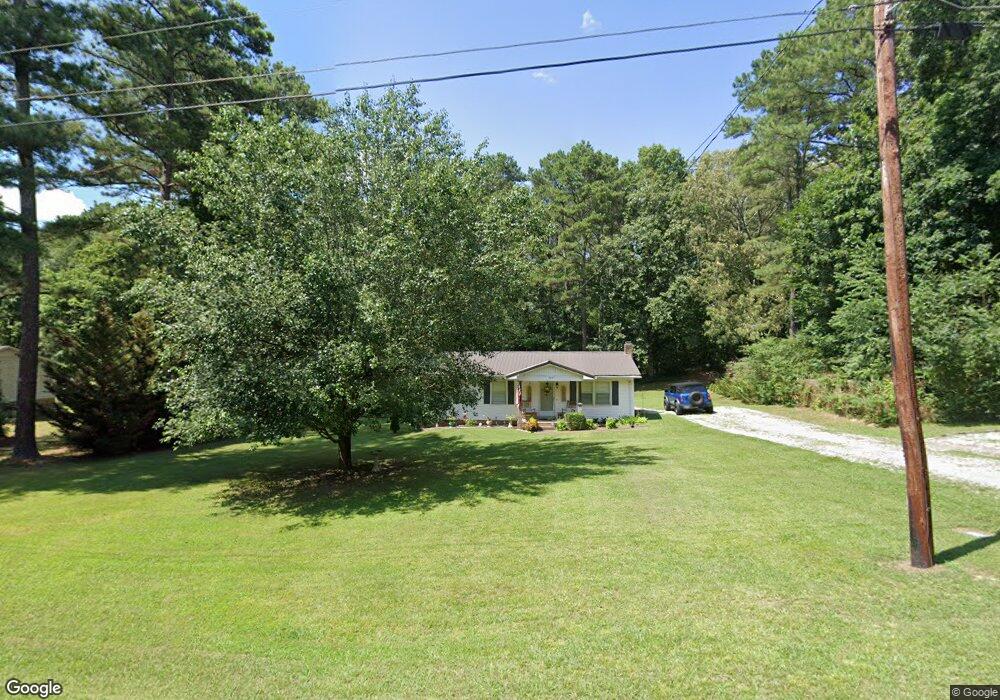
935 Rosier Rd Lawrenceburg, TN 38464
Estimated Value: $136,828 - $226,000
--
Bed
1
Bath
1,032
Sq Ft
$174/Sq Ft
Est. Value
About This Home
This home is located at 935 Rosier Rd, Lawrenceburg, TN 38464 and is currently estimated at $179,457, approximately $173 per square foot. 935 Rosier Rd is a home located in Lawrence County with nearby schools including Lawrenceburg Public Elementary School, Ingram Sowell Elementary School, and David Crockett Elementary School.
Ownership History
Date
Name
Owned For
Owner Type
Purchase Details
Closed on
Sep 20, 1999
Sold by
Mark Holt
Bought by
Jones William A
Current Estimated Value
Home Financials for this Owner
Home Financials are based on the most recent Mortgage that was taken out on this home.
Original Mortgage
$43,200
Outstanding Balance
$12,647
Interest Rate
7.89%
Estimated Equity
$166,810
Purchase Details
Closed on
Jan 14, 1999
Sold by
Nations Banc Mortgage Corp
Bought by
Mark Holt
Purchase Details
Closed on
Nov 15, 1996
Sold by
Scottie Gobble
Bought by
Ricky Alexander
Purchase Details
Closed on
Sep 29, 1994
Bought by
Gobble Scottie and Gobble Michael Gobble
Purchase Details
Closed on
Dec 2, 1988
Bought by
Pruiett Royce G and Pruiett Christine L
Purchase Details
Closed on
Oct 3, 1988
Bought by
Farmers Home Adm
Purchase Details
Closed on
Aug 26, 1985
Bought by
Robertson Sharon L
Purchase Details
Closed on
Jan 1, 1983
Create a Home Valuation Report for This Property
The Home Valuation Report is an in-depth analysis detailing your home's value as well as a comparison with similar homes in the area
Home Values in the Area
Average Home Value in this Area
Purchase History
| Date | Buyer | Sale Price | Title Company |
|---|---|---|---|
| Jones William A | $48,000 | -- | |
| Mark Holt | $34,000 | -- | |
| Ricky Alexander | $52,500 | -- | |
| Gobble Scottie | $33,500 | -- | |
| Pruiett Royce G | -- | -- | |
| Farmers Home Adm | -- | -- | |
| Robertson Sharon L | -- | -- | |
| -- | $29,000 | -- |
Source: Public Records
Mortgage History
| Date | Status | Borrower | Loan Amount |
|---|---|---|---|
| Open | Not Available | $43,200 |
Source: Public Records
Tax History Compared to Growth
Tax History
| Year | Tax Paid | Tax Assessment Tax Assessment Total Assessment is a certain percentage of the fair market value that is determined by local assessors to be the total taxable value of land and additions on the property. | Land | Improvement |
|---|---|---|---|---|
| 2025 | $504 | $25,075 | $0 | $0 |
| 2024 | $504 | $25,075 | $4,000 | $21,075 |
| 2023 | $504 | $25,075 | $4,000 | $21,075 |
| 2022 | $504 | $25,075 | $4,000 | $21,075 |
| 2021 | $356 | $12,025 | $2,500 | $9,525 |
| 2020 | $356 | $12,025 | $2,500 | $9,525 |
| 2019 | $356 | $12,025 | $2,500 | $9,525 |
| 2018 | $356 | $12,025 | $2,500 | $9,525 |
| 2017 | $356 | $12,025 | $2,500 | $9,525 |
| 2016 | $356 | $12,025 | $2,500 | $9,525 |
| 2015 | $329 | $12,025 | $2,500 | $9,525 |
| 2014 | $329 | $12,025 | $2,500 | $9,525 |
Source: Public Records
Map
Nearby Homes
- 1015 Rosier Rd
- 1005 Rosier Rd
- 915 Rosier Rd
- 905 Rosier Rd
- 1240 Fall River Rd
- 1020 Rosier Rd
- 1010 Rosier Rd
- 1030 Rosier Rd
- 1040 Rosier Rd
- 1050 Rosier Rd
- 1210 Fall River Rd
- 1060 Rosier Rd
- 1080 Rosier Rd
- 1360 Fall River Rd
- 1116 Fall River Rd
- 1117 Hickory St
- 1090 Rosier Rd
- 1116 Hickory St
- 1113 Hickory St
- 1380 Fall River Rd