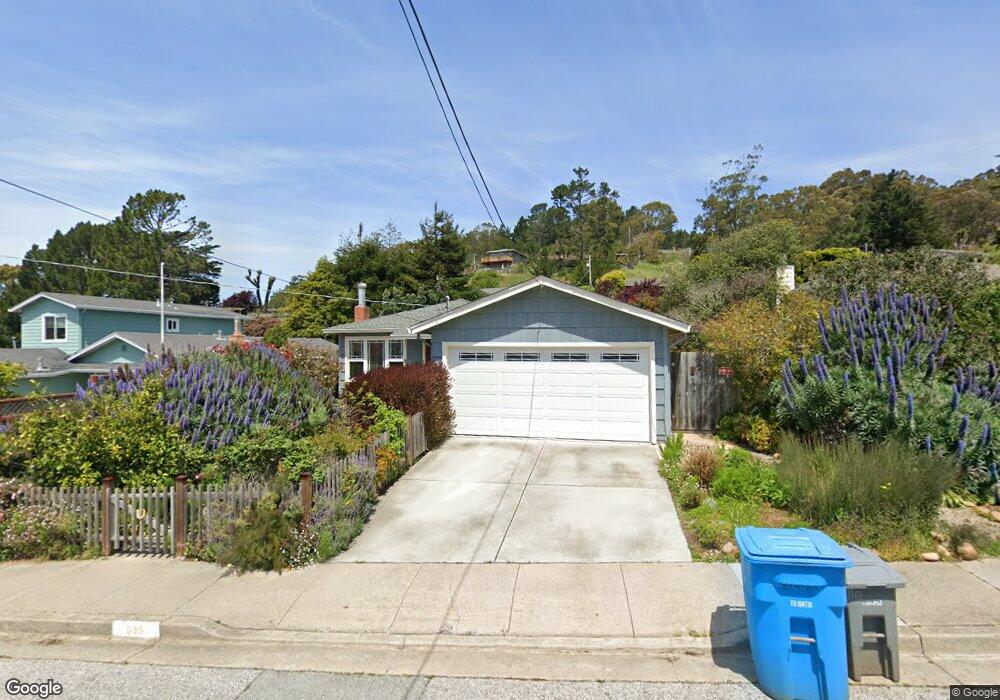
935 Serena Dr Pacifica, CA 94044
Linda Mar NeighborhoodEstimated Value: $1,129,750 - $1,307,000
3
Beds
1
Bath
1,040
Sq Ft
$1,164/Sq Ft
Est. Value
About This Home
This home is located at 935 Serena Dr, Pacifica, CA 94044 and is currently estimated at $1,210,438, approximately $1,163 per square foot. 935 Serena Dr is a home located in San Mateo County with nearby schools including Cabrillo Elementary School, Vallemar Elementary School, and Ocean Shore Elementary School.
Ownership History
Date
Name
Owned For
Owner Type
Purchase Details
Closed on
Mar 30, 2022
Sold by
Obrien Jonathan L and Obrien Sue Peggy
Bought by
Jonathan And Peggy Obrien 2022 Family Trust
Current Estimated Value
Purchase Details
Closed on
Jul 21, 1999
Sold by
Sonia Mariona
Bought by
Obrien Jonathan L and Obrien Peggy Sue
Home Financials for this Owner
Home Financials are based on the most recent Mortgage that was taken out on this home.
Original Mortgage
$240,000
Interest Rate
7.64%
Purchase Details
Closed on
Apr 9, 1997
Sold by
Medina Alexandra
Bought by
Mariona Sonia
Purchase Details
Closed on
Dec 8, 1995
Sold by
Hiller Scott R and Hiller Christiane Hipps
Bought by
Medina Alexandra and Mariona Sonia
Home Financials for this Owner
Home Financials are based on the most recent Mortgage that was taken out on this home.
Original Mortgage
$209,000
Interest Rate
7.87%
Create a Home Valuation Report for This Property
The Home Valuation Report is an in-depth analysis detailing your home's value as well as a comparison with similar homes in the area
Home Values in the Area
Average Home Value in this Area
Purchase History
| Date | Buyer | Sale Price | Title Company |
|---|---|---|---|
| Jonathan And Peggy Obrien 2022 Family Trust | -- | None Listed On Document | |
| Obrien Jonathan L | $333,000 | Commonwealth Land Title Co | |
| Mariona Sonia | -- | -- | |
| Medina Alexandra | $220,000 | Fidelity National Title Ins |
Source: Public Records
Mortgage History
| Date | Status | Borrower | Loan Amount |
|---|---|---|---|
| Previous Owner | Obrien Jonathan L | $240,000 | |
| Previous Owner | Medina Alexandra | $209,000 | |
| Closed | Obrien Jonathan L | $26,400 |
Source: Public Records
Tax History
| Year | Tax Paid | Tax Assessment Tax Assessment Total Assessment is a certain percentage of the fair market value that is determined by local assessors to be the total taxable value of land and additions on the property. | Land | Improvement |
|---|---|---|---|---|
| 2025 | $7,817 | $511,790 | $255,895 | $255,895 |
| 2023 | $7,817 | $491,918 | $245,959 | $245,959 |
| 2022 | $7,365 | $482,274 | $241,137 | $241,137 |
| 2021 | $7,209 | $472,818 | $236,409 | $236,409 |
| 2020 | $6,945 | $467,970 | $233,985 | $233,985 |
| 2019 | $6,699 | $458,796 | $229,398 | $229,398 |
| 2018 | $6,356 | $449,800 | $224,900 | $224,900 |
| 2017 | $6,095 | $440,982 | $220,491 | $220,491 |
| 2016 | $5,840 | $432,336 | $216,168 | $216,168 |
| 2015 | $5,982 | $425,842 | $212,921 | $212,921 |
| 2014 | $6,306 | $417,502 | $208,751 | $208,751 |
Source: Public Records
Map
Nearby Homes
- 1184 Escalero Ave
- 1016 Escalero Ave
- 1135 Valencia Way
- 1155 Crespi Dr
- 939 Fassler Ave
- 0 Balboa Way
- 827 Fassler Ave
- 2 Celia Ct
- 670 Roberts Rd
- 821 Fassler Ave
- 809 Fassler Ave
- 0 Spruce Ct
- 00 Adobe Dr
- 1 Ohlone Dr
- 0 Calera Terrace Unit ML82039911
- 0 Calera Terrace Unit ML82028895
- 0 Calera Terrace Unit ML82040433
- 1695 Higgins Way
- 1358 Terra Nova Blvd
- 837 Fassler Ave
Your Personal Tour Guide
Ask me questions while you tour the home.