
Seller's Agent in 2025
Omar Hajjar
The Naumann Group
(850) 339-9830
3 in this area
186 Total Sales
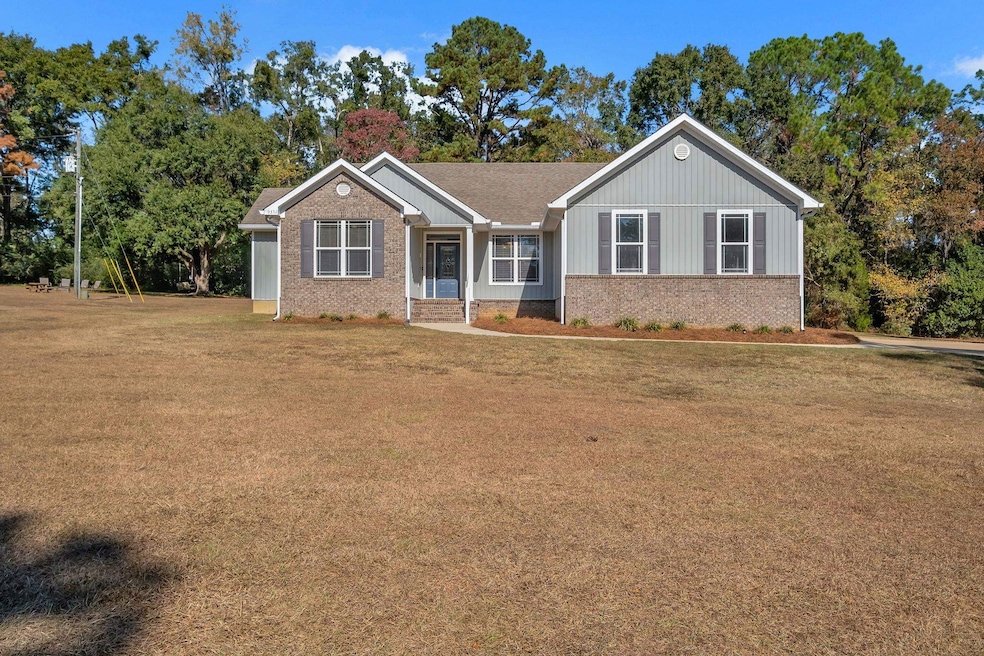
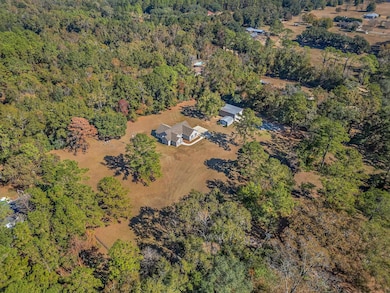
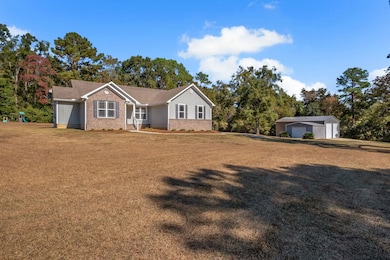
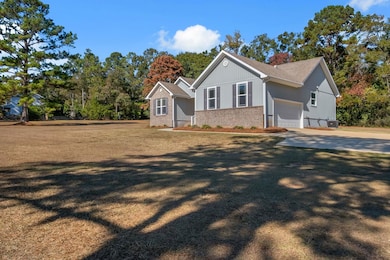
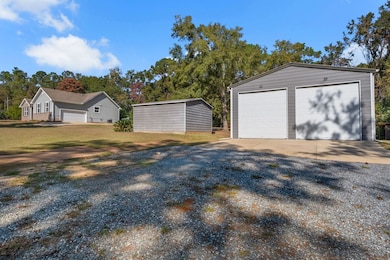
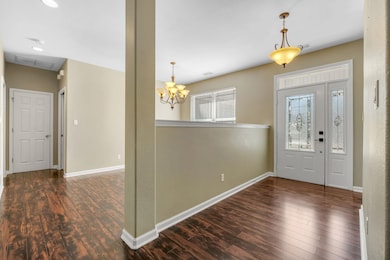
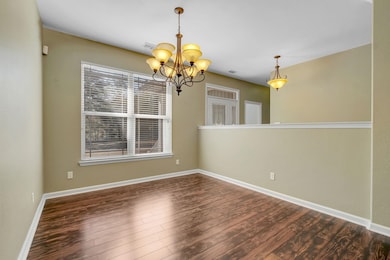
Discover peaceful east Tallahassee living on more than 3 private acres—a rare find. Built in 2008, this inviting 3-bedroom, 2-bathroom home offers a comfortable blend of space and functionality. Inside, enjoy trey ceilings, a bright eat-in kitchen, and a large primary suite designed for relaxation. A screened porch overlooks the expansive property, perfect for unwinding and taking in the quiet surroundings. Ideal for hobbyists, business owners, or equestrian needs, the property features two impressive workshops. The first is climate-controlled, offering year-round comfort for projects or storage. The second boasts three 12-ft rolling doors, providing exceptional access for equipment, trailers, or large vehicles. With room to roam and endless potential, this property delivers the perfect balance of privacy, versatility, and East Tallahassee convenience. Buyer to verify all measurements.
Last Agent to Sell the Property
The Naumann Group Real Estate License #3615554 Listed on: 11/18/2025
| Date | Type | Sale Price | Title Company |
|---|---|---|---|
| Warranty Deed | $497,500 | None Listed On Document | |
| Warranty Deed | $300,000 | Attorney | |
| Warranty Deed | $220,000 | Attorney | |
| Quit Claim Deed | -- | -- | |
| Warranty Deed | $66,300 | -- |
| Date | Status | Loan Amount | Loan Type |
|---|---|---|---|
| Previous Owner | $291,000 | New Conventional | |
| Previous Owner | $224,489 | Unknown | |
| Previous Owner | $66,250 | FHA |
| Date | Event | Price | List to Sale | Price per Sq Ft |
|---|---|---|---|---|
| 12/15/2025 12/15/25 | Sold | $497,500 | 0.0% | $291 / Sq Ft |
| 12/03/2025 12/03/25 | For Sale | $497,500 | 0.0% | $291 / Sq Ft |
| 12/03/2025 12/03/25 | Pending | -- | -- | -- |
| 11/18/2025 11/18/25 | For Sale | $497,500 | -- | $291 / Sq Ft |
| Year | Tax Paid | Tax Assessment Tax Assessment Total Assessment is a certain percentage of the fair market value that is determined by local assessors to be the total taxable value of land and additions on the property. | Land | Improvement |
|---|---|---|---|---|
| 2025 | $4,577 | $327,161 | -- | -- |
| 2024 | $4,453 | $317,941 | -- | -- |
| 2023 | $3,696 | $265,509 | $0 | $0 |
| 2022 | $3,498 | $257,776 | $0 | $0 |
| 2021 | $3,480 | $250,268 | $0 | $0 |
| 2020 | $3,374 | $246,813 | $0 | $0 |
| 2019 | $3,475 | $241,264 | $54,080 | $187,184 |
| 2018 | $2,614 | $203,420 | $0 | $0 |
| 2017 | $2,591 | $199,236 | $0 | $0 |
| 2016 | $2,575 | $195,138 | $0 | $0 |
| 2015 | $2,619 | $193,782 | $0 | $0 |
| 2014 | $2,619 | $192,244 | $0 | $0 |
Seller's Agent in 2025
Omar Hajjar
The Naumann Group
(850) 339-9830
3 in this area
186 Total Sales
Buyer's Agent in 2025
Katherine Hansli Searcy
The Naumann Group
(850) 766-1444
8 in this area
230 Total Sales
Source: Capital Area Technology & REALTOR® Services (Tallahassee Board of REALTORS®)
MLS Number: 393370
APN: 12-34-20-228-000.0
Disclaimer: Certain information contained herein is derived from information provided by parties other than Homes.com. All information provided is deemed reliable, but is not guaranteed to be accurate and should be independently verified.
![]() IDX information is provided exclusively for personal, non-commercial use, and may not be used for any purpose other than to identify prospective properties consumers may be interested in purchasing.
IDX information is provided exclusively for personal, non-commercial use, and may not be used for any purpose other than to identify prospective properties consumers may be interested in purchasing.
Information is deemed reliable but not guaranteed.
Ask me questions while you tour the home.