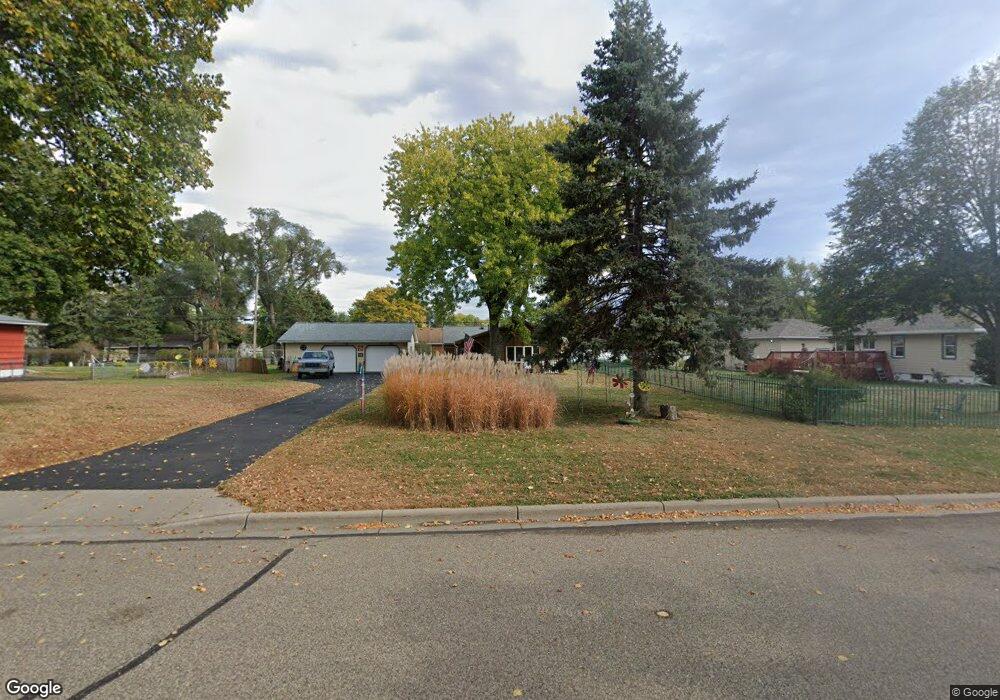
936 936 Laurel Ave St. Paul Park, MN 55071
Estimated Value: $276,000 - $290,000
2
Beds
1
Bath
1,086
Sq Ft
$262/Sq Ft
Est. Value
About This Home
This home is located at 936 936 Laurel Ave, St. Paul Park, MN 55071 and is currently estimated at $284,227, approximately $261 per square foot. 936 936 Laurel Ave is a home located in Washington County with nearby schools including Pullman Elementary School, Oltman Middle School, and Park Senior High School.
Ownership History
Date
Name
Owned For
Owner Type
Purchase Details
Closed on
Mar 15, 2010
Sold by
Sovereign Bank
Bought by
Schindeldecker Mark R and Schindeldecker Joleen
Current Estimated Value
Home Financials for this Owner
Home Financials are based on the most recent Mortgage that was taken out on this home.
Original Mortgage
$70,640
Outstanding Balance
$46,865
Interest Rate
5%
Mortgage Type
New Conventional
Estimated Equity
$237,362
Purchase Details
Closed on
Nov 9, 2006
Sold by
Christensen April
Bought by
Payne Daniel
Purchase Details
Closed on
Oct 24, 2006
Sold by
Christensen April
Bought by
Payne Daniel
Purchase Details
Closed on
Dec 29, 2005
Sold by
Chalupsky Tiffany T and Chalupsky Kenneth P
Bought by
Christensen April L
Purchase Details
Closed on
Jun 29, 2005
Sold by
Koubele Sheryl A and Koubele Brian
Bought by
Chalupsky Tiffany T
Purchase Details
Closed on
Dec 30, 1996
Sold by
Mussetter John G and Mussetter Loretta J
Bought by
Gorz Sheryl A
Create a Home Valuation Report for This Property
The Home Valuation Report is an in-depth analysis detailing your home's value as well as a comparison with similar homes in the area
Home Values in the Area
Average Home Value in this Area
Purchase History
| Date | Buyer | Sale Price | Title Company |
|---|---|---|---|
| Schindeldecker Mark R | $88,300 | -- | |
| Payne Daniel | $183,000 | -- | |
| Payne Daniel | $183,000 | -- | |
| Christensen April L | $180,894 | -- | |
| Chalupsky Tiffany T | $176,000 | -- | |
| Gorz Sheryl A | $80,000 | -- |
Source: Public Records
Mortgage History
| Date | Status | Borrower | Loan Amount |
|---|---|---|---|
| Open | Schindeldecker Mark R | $70,640 |
Source: Public Records
Tax History Compared to Growth
Tax History
| Year | Tax Paid | Tax Assessment Tax Assessment Total Assessment is a certain percentage of the fair market value that is determined by local assessors to be the total taxable value of land and additions on the property. | Land | Improvement |
|---|---|---|---|---|
| 2024 | $3,212 | $239,500 | $80,000 | $159,500 |
| 2023 | $3,212 | $237,700 | $91,000 | $146,700 |
| 2022 | $2,666 | $229,500 | $90,100 | $139,400 |
| 2021 | $2,700 | $187,800 | $75,000 | $112,800 |
| 2020 | $2,632 | $193,300 | $85,000 | $108,300 |
| 2019 | $2,398 | $185,700 | $76,000 | $109,700 |
| 2018 | $2,364 | $158,400 | $63,000 | $95,400 |
| 2017 | $2,204 | $156,000 | $63,000 | $93,000 |
| 2016 | $1,976 | $148,200 | $58,000 | $90,200 |
| 2015 | $1,694 | $116,000 | $45,400 | $70,600 |
| 2013 | -- | $94,000 | $35,400 | $58,600 |
Source: Public Records
Map
Nearby Homes
- 1313 11th Ave
- 816 Holley Ave
- 1033 Portland Ave
- 1200 Laurel Ave
- 801 Summit Ave
- 1200 Summit Ave
- 730 Pleasant Ave
- 1121 5th St
- 1601 14th Ave
- 1227 5th St
- TBD Broadway Ave
- 928 1st St
- 11XX 1st St
- 1142 1st St
- 1020 Gary Dr
- 6745 Wildflower Dr S
- 6467 82nd St S
- 6444 Genevieve Trail
- 6564 Genevieve Trail
- 6538 Genevieve Trail
- 936 Laurel Ave
- 944 Laurel Ave
- 930 Laurel Ave
- 929 Lincoln Ave
- 945 Lincoln Ave
- 925 Lincoln Ave
- 924 Laurel Ave
- 921 Lincoln Ave
- 916 Laurel Ave
- 925 925 Lincoln Ave
- 1000 Laurel Ave
- 909 909 Lincoln Ave
- 909 Lincoln Ave
- 1005 Lincoln Ave
- 908 Laurel Ave
- 908 Laurel Ave
- 1001 Laurel Ave
- 1010 Laurel Ave
- 938 Lincoln Ave
- 932 Lincoln Ave