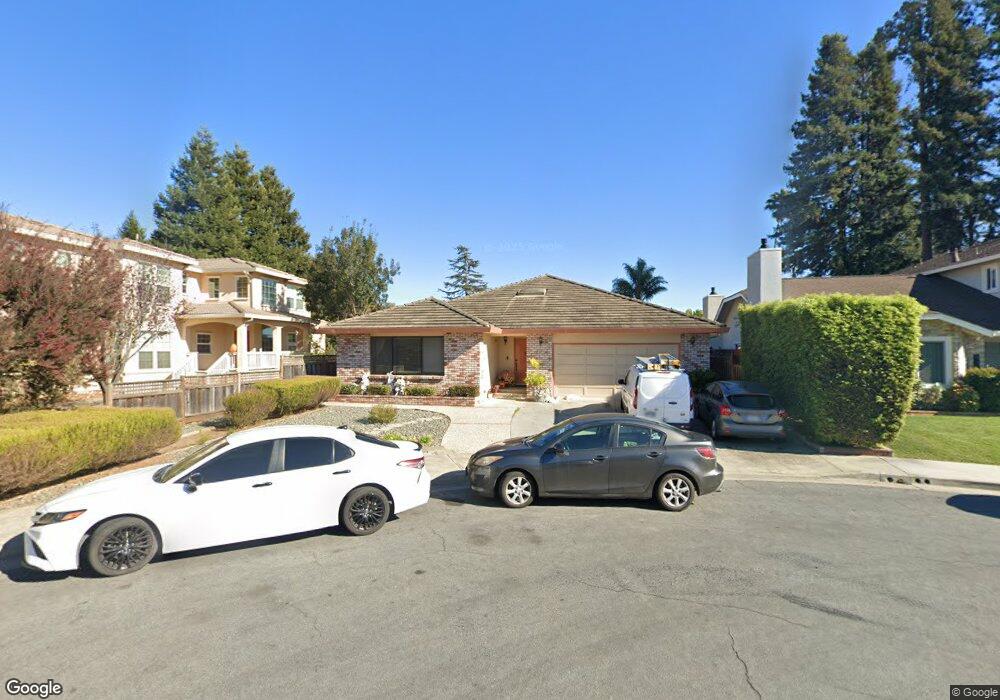
936 Acorn Way Watsonville, CA 95076
Estimated Value: $653,000 - $860,260
3
Beds
3
Baths
1,996
Sq Ft
$372/Sq Ft
Est. Value
About This Home
This home is located at 936 Acorn Way, Watsonville, CA 95076 and is currently estimated at $743,065, approximately $372 per square foot. 936 Acorn Way is a home located in Santa Cruz County with nearby schools including Ann Soldo Elementary School, Lakeview Middle School, and Watsonville High School.
Ownership History
Date
Name
Owned For
Owner Type
Purchase Details
Closed on
Jun 19, 2024
Sold by
Karen L Obertello Separate Property Trus and Ryan Kelly
Bought by
Janet Mcentee Heien Trust and Heien
Current Estimated Value
Purchase Details
Closed on
Nov 25, 2013
Sold by
Obertello Karen L
Bought by
Obertello Karen L and Karen L Obertello Separate Pro
Purchase Details
Closed on
May 15, 2002
Sold by
Mcentee Myrtle L and The John T Mcentee Jr & Myrtle
Bought by
Mcentee Myrtle L and Mcentee John T
Create a Home Valuation Report for This Property
The Home Valuation Report is an in-depth analysis detailing your home's value as well as a comparison with similar homes in the area
Home Values in the Area
Average Home Value in this Area
Purchase History
| Date | Buyer | Sale Price | Title Company |
|---|---|---|---|
| Janet Mcentee Heien Trust | $425,000 | Chicago Title | |
| Obertello Karen L | -- | None Available | |
| Heien Janet Mcentee | -- | None Available | |
| Heien Janet M | -- | None Available | |
| Mcentee Myrtle L | -- | -- |
Source: Public Records
Tax History Compared to Growth
Tax History
| Year | Tax Paid | Tax Assessment Tax Assessment Total Assessment is a certain percentage of the fair market value that is determined by local assessors to be the total taxable value of land and additions on the property. | Land | Improvement |
|---|---|---|---|---|
| 2025 | $6,677 | $598,359 | $338,883 | $259,476 |
| 2023 | $3,810 | $316,914 | $112,232 | $204,682 |
| 2022 | $3,743 | $310,700 | $110,030 | $200,670 |
| 2021 | $3,681 | $304,608 | $107,874 | $196,734 |
| 2020 | $3,629 | $301,486 | $106,768 | $194,718 |
| 2019 | $3,565 | $295,574 | $104,674 | $190,900 |
| 2018 | $3,475 | $289,778 | $102,622 | $187,156 |
| 2017 | $3,445 | $284,096 | $100,610 | $183,486 |
| 2016 | $3,356 | $278,526 | $98,638 | $179,888 |
| 2015 | $3,345 | $274,342 | $97,156 | $177,186 |
| 2014 | $3,273 | $268,968 | $95,252 | $173,716 |
Source: Public Records
Map
Nearby Homes