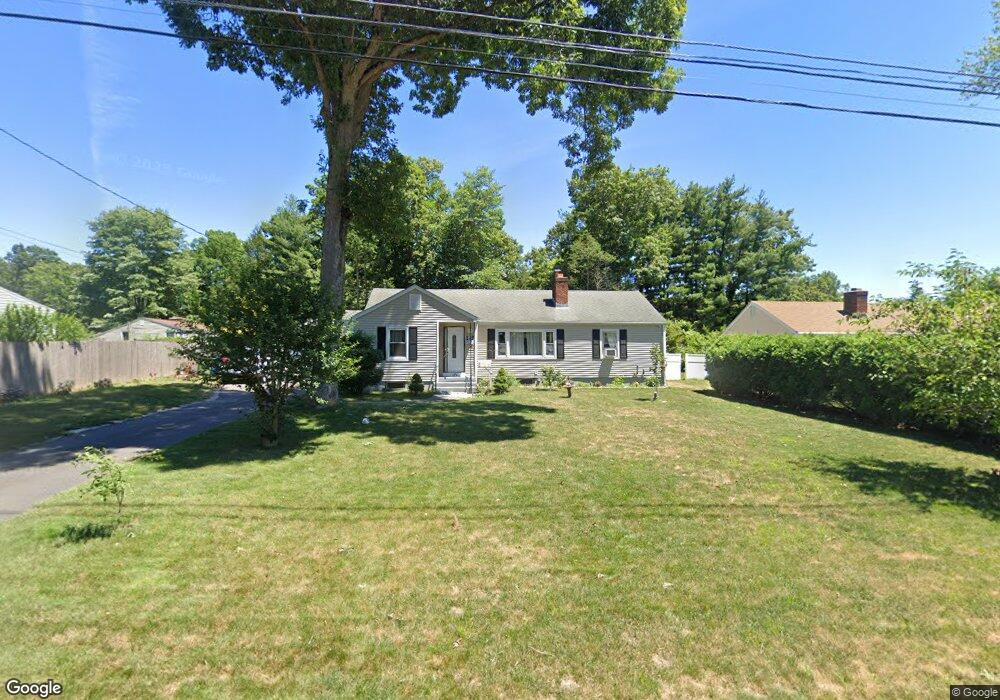
936 Delilah Dr Windsor, CT 06095
West Windsor NeighborhoodEstimated Value: $308,000 - $314,752
2
Beds
2
Baths
1,267
Sq Ft
$246/Sq Ft
Est. Value
About This Home
This home is located at 936 Delilah Dr, Windsor, CT 06095 and is currently estimated at $311,938, approximately $246 per square foot. 936 Delilah Dr is a home located in Hartford County with nearby schools including Poquonock Elementary School, Clover Street School, and Sage Park Middle School.
Ownership History
Date
Name
Owned For
Owner Type
Purchase Details
Closed on
Feb 23, 2007
Sold by
Cheney Sean and Cheney Brooke
Bought by
Patrick Eroida
Current Estimated Value
Home Financials for this Owner
Home Financials are based on the most recent Mortgage that was taken out on this home.
Original Mortgage
$198,550
Outstanding Balance
$119,385
Interest Rate
6.23%
Mortgage Type
Purchase Money Mortgage
Estimated Equity
$192,553
Purchase Details
Closed on
Feb 19, 1999
Sold by
Sica Richard Est and Sica
Bought by
Cherry Sean and Reynolds Brooke
Home Financials for this Owner
Home Financials are based on the most recent Mortgage that was taken out on this home.
Original Mortgage
$90,000
Interest Rate
6.75%
Mortgage Type
Purchase Money Mortgage
Purchase Details
Closed on
Jul 1, 1997
Sold by
Cashman Daniel and Stavola Justina
Bought by
Sica Richard
Purchase Details
Closed on
Jun 8, 1992
Sold by
Herbert Janet and Herbert Norman
Bought by
Stavola Justina and Cashman Daniel
Purchase Details
Closed on
Jun 8, 1987
Sold by
Connolly John
Bought by
Hebert Norman
Create a Home Valuation Report for This Property
The Home Valuation Report is an in-depth analysis detailing your home's value as well as a comparison with similar homes in the area
Home Values in the Area
Average Home Value in this Area
Purchase History
| Date | Buyer | Sale Price | Title Company |
|---|---|---|---|
| Patrick Eroida | $209,000 | -- | |
| Cherry Sean | $112,500 | -- | |
| Sica Richard | $123,500 | -- | |
| Stavola Justina | $130,000 | -- | |
| Hebert Norman | $141,500 | -- |
Source: Public Records
Mortgage History
| Date | Status | Borrower | Loan Amount |
|---|---|---|---|
| Open | Hebert Norman | $198,550 | |
| Previous Owner | Hebert Norman | $23,000 | |
| Previous Owner | Hebert Norman | $90,000 |
Source: Public Records
Tax History Compared to Growth
Tax History
| Year | Tax Paid | Tax Assessment Tax Assessment Total Assessment is a certain percentage of the fair market value that is determined by local assessors to be the total taxable value of land and additions on the property. | Land | Improvement |
|---|---|---|---|---|
| 2024 | $5,503 | $181,510 | $57,960 | $123,550 |
| 2023 | $4,151 | $123,550 | $45,500 | $78,050 |
| 2022 | $4,111 | $123,550 | $45,500 | $78,050 |
| 2021 | $4,111 | $123,550 | $45,500 | $78,050 |
| 2020 | $4,091 | $123,550 | $45,500 | $78,050 |
| 2019 | $4,001 | $123,550 | $45,500 | $78,050 |
| 2018 | $3,858 | $117,040 | $45,500 | $71,540 |
| 2017 | $3,798 | $117,040 | $45,500 | $71,540 |
| 2016 | $3,817 | $121,100 | $45,500 | $75,600 |
| 2015 | $3,744 | $121,100 | $45,500 | $75,600 |
| 2014 | $3,690 | $121,100 | $45,500 | $75,600 |
Source: Public Records
Map
Nearby Homes
- 33 Nod Rd
- 29 Quail Hollow Dr
- 28 Sunnyfield Dr
- 41 Hale Dr
- 107 Sunnyfield Dr
- 420 Tributary Ct
- 149 Tobey Ave
- 170 Rood Ave
- 99 Pepperbush Way
- 780 Park Ave
- 77 Pine Lane Extension
- 170 Dudley Town Rd
- 145 Park Ave
- 21 Long Hill Rd
- 8 Matthew Ln
- 29 Alexander Rd
- 15 Alexander Rd
- 75 Wilton Rd
- 45 E Wintonbury Ave
- 11 Parents Way