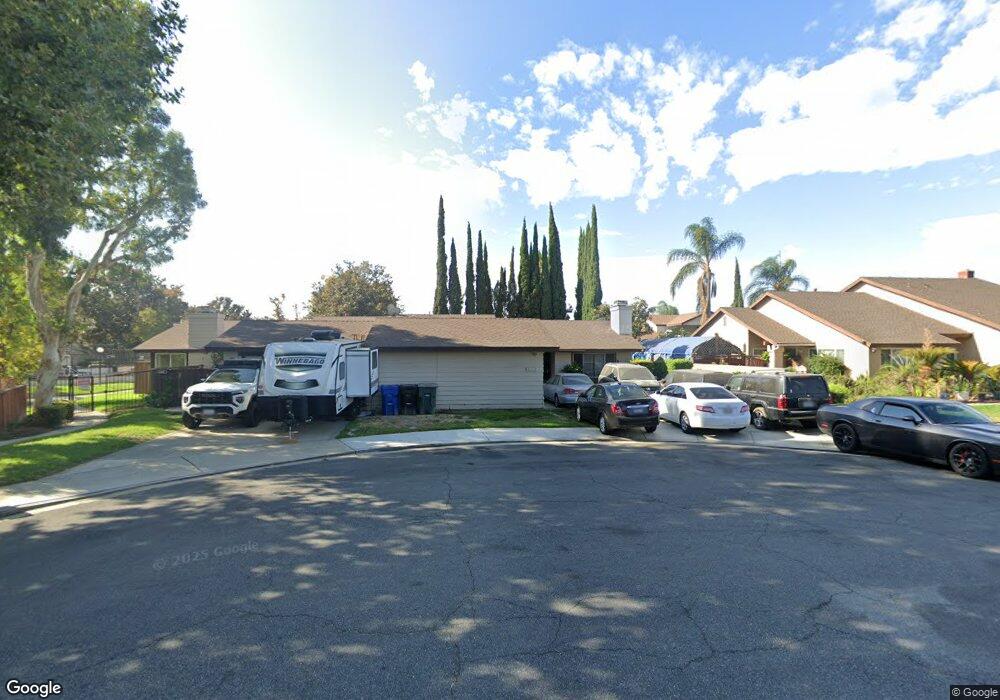
936 E Monticello Ct Ontario, CA 91761
Downtown Ontario NeighborhoodEstimated Value: $460,000 - $512,000
3
Beds
2
Baths
1,272
Sq Ft
$387/Sq Ft
Est. Value
About This Home
This home is located at 936 E Monticello Ct, Ontario, CA 91761 and is currently estimated at $491,740, approximately $386 per square foot. 936 E Monticello Ct is a home located in San Bernardino County with nearby schools including Bon View Elementary, De Anza Middle, and Ontario High School.
Ownership History
Date
Name
Owned For
Owner Type
Purchase Details
Closed on
Sep 19, 2003
Sold by
Grant Ronald R
Bought by
Tsuha Lance and Tercero Olga L
Current Estimated Value
Home Financials for this Owner
Home Financials are based on the most recent Mortgage that was taken out on this home.
Original Mortgage
$220,190
Interest Rate
5.97%
Mortgage Type
FHA
Create a Home Valuation Report for This Property
The Home Valuation Report is an in-depth analysis detailing your home's value as well as a comparison with similar homes in the area
Home Values in the Area
Average Home Value in this Area
Purchase History
| Date | Buyer | Sale Price | Title Company |
|---|---|---|---|
| Tsuha Lance | $227,000 | Chicago Title Co |
Source: Public Records
Mortgage History
| Date | Status | Borrower | Loan Amount |
|---|---|---|---|
| Previous Owner | Tsuha Lance | $220,190 |
Source: Public Records
Tax History
| Year | Tax Paid | Tax Assessment Tax Assessment Total Assessment is a certain percentage of the fair market value that is determined by local assessors to be the total taxable value of land and additions on the property. | Land | Improvement |
|---|---|---|---|---|
| 2025 | $3,563 | $322,747 | $112,962 | $209,785 |
| 2024 | $3,483 | $316,419 | $110,747 | $205,672 |
| 2023 | $3,385 | $310,214 | $108,575 | $201,639 |
| 2022 | $3,341 | $304,131 | $106,446 | $197,685 |
| 2021 | $3,320 | $298,168 | $104,359 | $193,809 |
| 2020 | $3,262 | $295,111 | $103,289 | $191,822 |
| 2019 | $3,235 | $289,325 | $101,264 | $188,061 |
| 2018 | $3,190 | $283,652 | $99,278 | $184,374 |
| 2017 | $2,711 | $244,800 | $86,000 | $158,800 |
| 2016 | $2,531 | $233,100 | $81,900 | $151,200 |
| 2015 | $2,432 | $222,000 | $78,000 | $144,000 |
| 2014 | $2,264 | $209,000 | $73,000 | $136,000 |
Source: Public Records
Map
Nearby Homes
- 4315 S Grasly Paseo
- 0 Vineyard Unit CV25067044
- 1528 1538 W Holt
- 1305 W North Pinecrest
- 2408 S Taylor Place
- 2119 S Phoenix Place
- 2431 S Marigold Place
- 840 E Cedar St
- 2310 S Cucamonga Ave
- 2001 S Campus Ave Unit 7F
- 2644 S Cucamonga Ave
- 513 E Fairfield Ct
- 2300 S Sultana Ave Unit 298
- 2300 S Sultana Ave Unit 286
- 2300 S Sultana Ave Unit 256
- 2300 S Sultana Ave Unit 206
- 310 E Philadelphia St Unit 147
- 310 E Philadelphia St Unit SPC 102
- 2413 S Parco Ave
- 2410 S Sandpiper Place
- 942 E Monticello Ct Unit 35
- 942 E Monticello Ct
- 930 E Monticello Ct
- 943 Shearwater St
- 937 Shearwater St
- 931 Shearwater St
- 926 E Monticello Ct
- 937 E Monticello Ct Unit 18
- 943 E Monticello Ct Unit 19
- 925 Shearwater St
- 2254 S Greenwood Place
- 2254 S Greenwood Place Unit 32
- 2254 S Greenwood Place Unit E
- 2254 S Greenwood Place Unit D
- 2254 S Greenwood Place Unit A
- 2254 S Greenwood Place Unit B
- 2308 S Greenwood Place Unit D
- 2308 S Greenwood Place
- 2308 S Greenwood Place Unit A
- 2308 S Greenwood Place Unit B
Your Personal Tour Guide
Ask me questions while you tour the home.