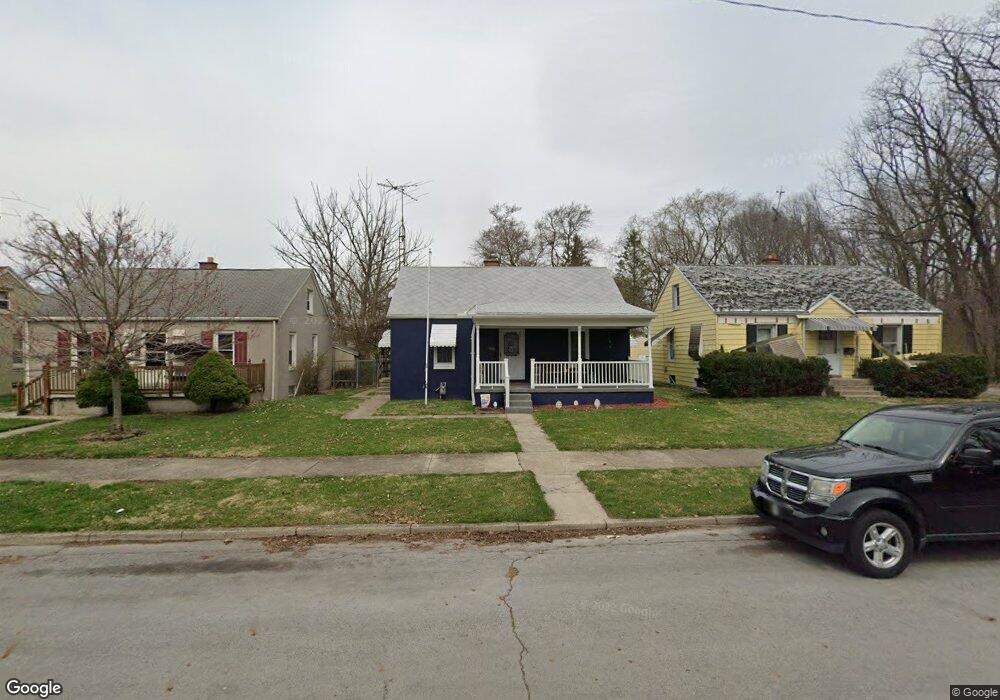
936 E Rose St Springfield, OH 45505
Estimated Value: $76,000 - $98,840
2
Beds
1
Bath
720
Sq Ft
$119/Sq Ft
Est. Value
About This Home
This home is located at 936 E Rose St, Springfield, OH 45505 and is currently estimated at $85,710, approximately $119 per square foot. 936 E Rose St is a home located in Clark County with nearby schools including Lincoln Elementary School, Hayward Middle School, and Springfield High School.
Ownership History
Date
Name
Owned For
Owner Type
Purchase Details
Closed on
May 17, 2006
Sold by
Clatworthy Jason D and Clatworthy Christina E
Bought by
Rice William W
Current Estimated Value
Home Financials for this Owner
Home Financials are based on the most recent Mortgage that was taken out on this home.
Original Mortgage
$38,000
Outstanding Balance
$21,846
Interest Rate
6.56%
Mortgage Type
Purchase Money Mortgage
Estimated Equity
$63,864
Purchase Details
Closed on
Aug 25, 2005
Sold by
Va
Bought by
Clatworthy Jason D and Clatworthy Christina E
Home Financials for this Owner
Home Financials are based on the most recent Mortgage that was taken out on this home.
Original Mortgage
$19,098
Interest Rate
5.93%
Mortgage Type
Fannie Mae Freddie Mac
Purchase Details
Closed on
Feb 10, 2005
Sold by
Smith Robert C
Bought by
Va
Create a Home Valuation Report for This Property
The Home Valuation Report is an in-depth analysis detailing your home's value as well as a comparison with similar homes in the area
Home Values in the Area
Average Home Value in this Area
Purchase History
| Date | Buyer | Sale Price | Title Company |
|---|---|---|---|
| Rice William W | $38,000 | None Available | |
| Clatworthy Jason D | -- | Fidelity Land Title Agency I | |
| Va | $20,000 | -- |
Source: Public Records
Mortgage History
| Date | Status | Borrower | Loan Amount |
|---|---|---|---|
| Open | Rice William W | $38,000 | |
| Previous Owner | Clatworthy Jason D | $19,098 |
Source: Public Records
Tax History
| Year | Tax Paid | Tax Assessment Tax Assessment Total Assessment is a certain percentage of the fair market value that is determined by local assessors to be the total taxable value of land and additions on the property. | Land | Improvement |
|---|---|---|---|---|
| 2025 | $702 | $18,920 | $2,840 | $16,080 |
| 2024 | $684 | $14,190 | $2,500 | $11,690 |
| 2023 | $684 | $14,190 | $2,500 | $11,690 |
| 2022 | $701 | $14,190 | $2,500 | $11,690 |
| 2021 | $626 | $11,710 | $2,030 | $9,680 |
| 2020 | $628 | $11,710 | $2,030 | $9,680 |
| 2019 | $629 | $11,710 | $2,030 | $9,680 |
| 2018 | $556 | $9,940 | $1,750 | $8,190 |
| 2017 | $556 | $9,941 | $1,754 | $8,187 |
| 2016 | $556 | $9,941 | $1,754 | $8,187 |
| 2015 | $634 | $11,113 | $1,845 | $9,268 |
| 2014 | $631 | $11,113 | $1,845 | $9,268 |
| 2013 | $624 | $11,113 | $1,845 | $9,268 |
Source: Public Records
Map
Nearby Homes
- 900 E Rose St
- 1111 Lafayette Ave
- 652 E Southern Ave
- 1440 Selma Rd
- 550 E Rose St
- 908 Pine St
- 1008 Tibbetts Ave
- 1724 Clay St
- 1502 Linden Ave
- 1005 Burt St
- 1846 Ohio Ave
- 441 E Euclid Ave
- 1820 Clay St
- 1823 Clay St
- 1225 Beacon St
- 230 Rice St
- 718 Summer St
- 705 York St
- 453 E Pleasant St
- 1417 Clifton Ave Unit 1419
Your Personal Tour Guide
Ask me questions while you tour the home.